TL;DR: IT staffing ROI is value generated minus engagement cost, over engagement cost. Four inputs feed it: cost saving, time saved, velocity gain and engagement cost. Each one has a way of misleading you, and the article below covers all four. Measure velocity after the ramp rather than during it, price the denominator without flattering it, and state your assumptions, because a finance reviewer will take a lower number with visible workings over a higher one without.
Every procurement conversation reaches the ROI question, and most answers are unfalsifiable. The number depends on which baseline you compare against, when you measure, and what you assume would have happened otherwise. This is the financial companion to when to use IT staffing versus in-house hiring and build versus buy.

What is the IT staffing ROI formula?
Value generated, minus engagement cost, divided by engagement cost.
Value generated is the sum of three things: what you saved against the in-house alternative, what the time compression was worth, and what the extra output was worth once the engineer had ramped.
The formula is the easy part. Defining the four terms is the work, and it is where an ROI case either earns trust or loses it.
Input 1: cost saving
The difference between what an equivalent in-house hire would cost, fully loaded, and what the engagement costs.
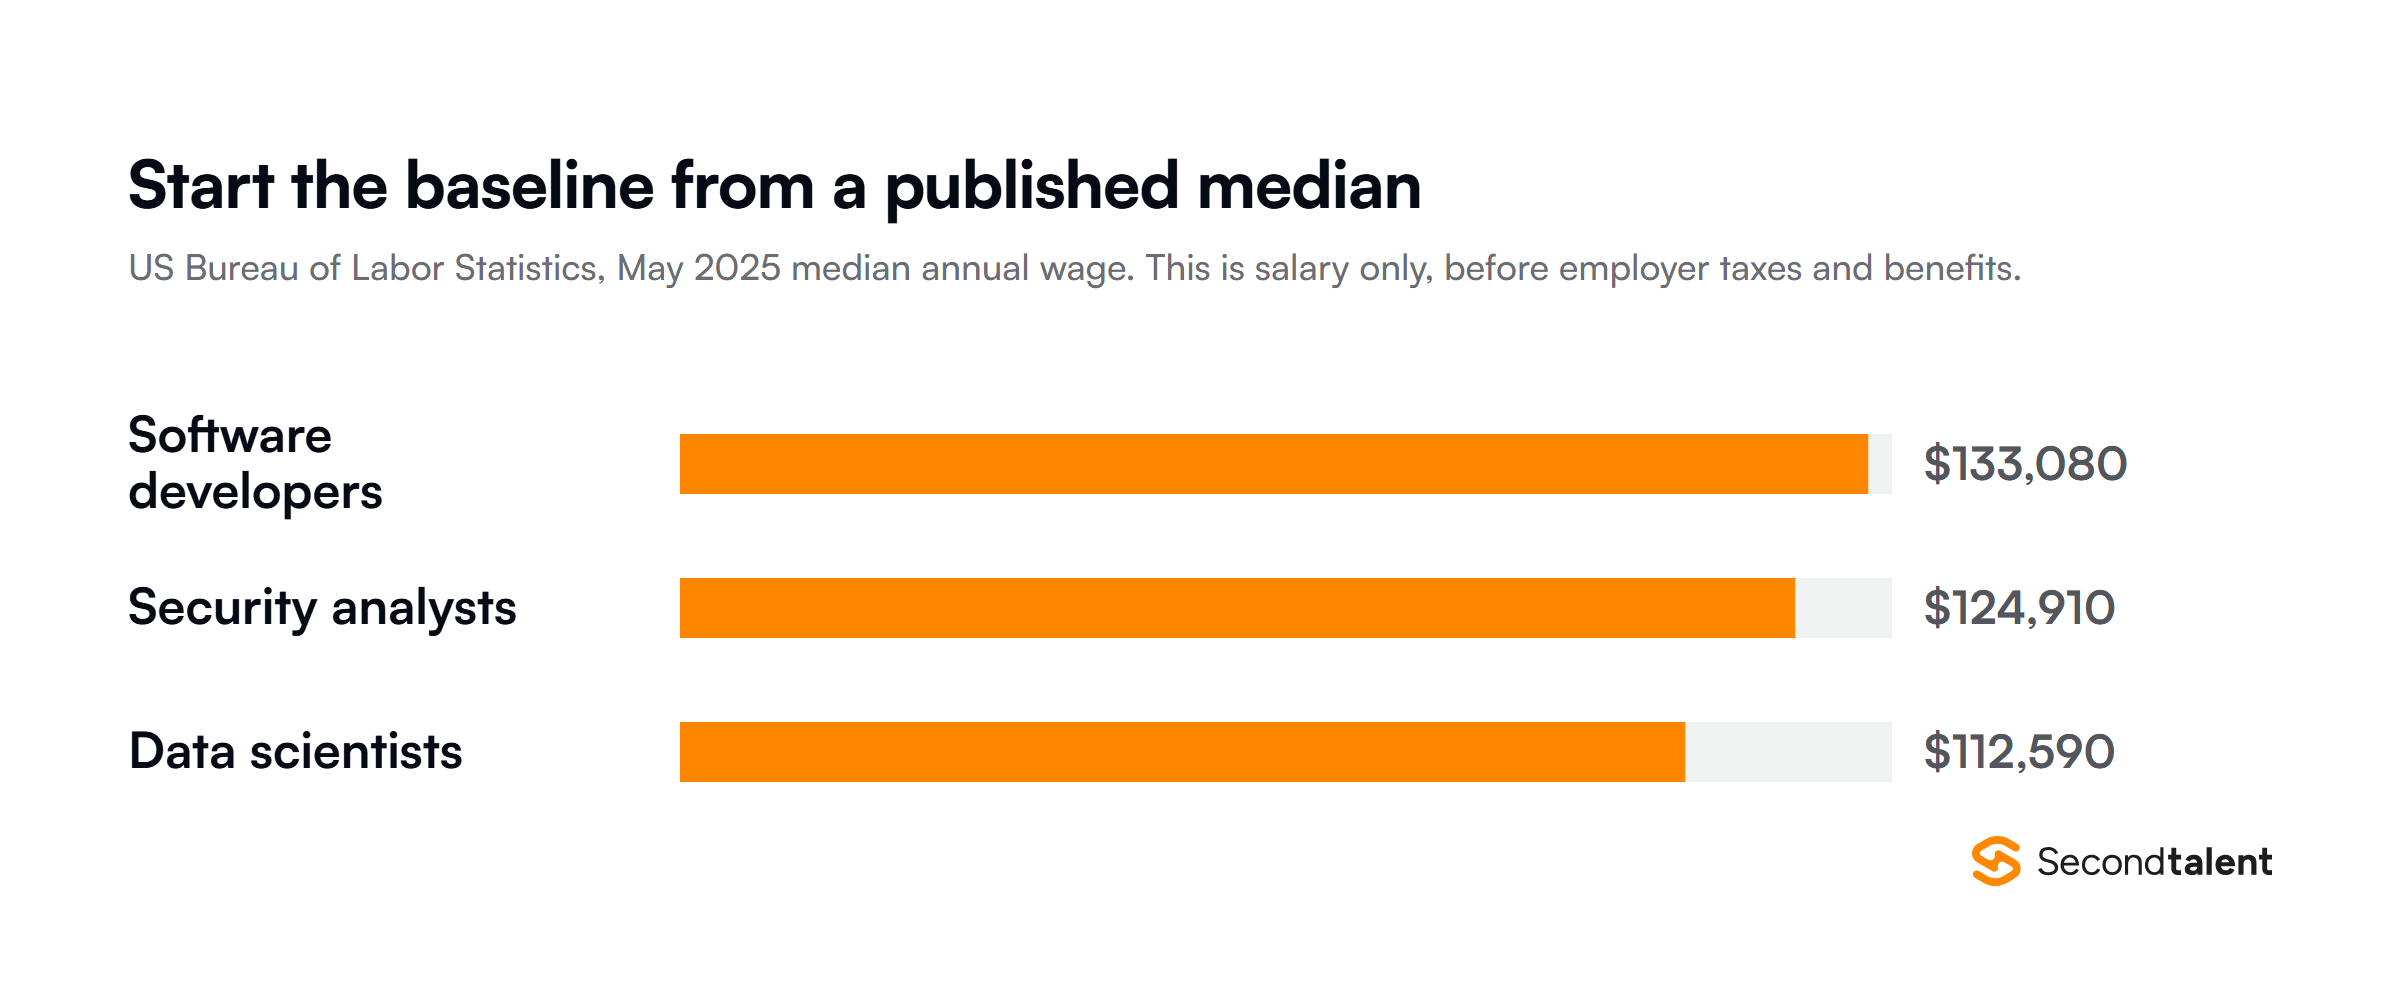
Start the in-house side from a published median rather than a memory of the last offer you made. The US Bureau of Labor Statistics puts the median wage for software developers at $135,980 in May 2025, security analysts at $129,180 and data scientists at $120,230.
Those are salary before employer taxes, benefits, equipment and tooling. Apply a loading multiplier to get to a fully loaded figure, and write down which multiplier you used. Naming it lets a reviewer argue with that one assumption rather than reject your whole model.
On the other side, use published rates. Second Talent’s developer rate cards give senior international client rates by role and market, and clients save $103,000 or more per hire against a comparable Western salary.
Input 2: time saved
The weeks between needing the role filled and having someone working, priced at what that gap costs you.
Two components. The hiring manager’s time, which you can price from their loaded cost per week. And whatever the empty seat was blocking, which is the larger number when the role gates a release or a revenue line.
Second Talent returns matched profiles within 24 hours, which is the compression figure to test your own baseline against. Whether that is worth 4 weeks or 14 depends entirely on how long your process takes today, so measure that first.
Input 3: velocity gain
Additional output per engineer against a baseline, measured after the ramp has finished.
Pick a measure you already track: pull requests merged, stories delivered, deployment frequency. Compare the augmented engineers against your own in-house baseline across a full quarter, then price the difference at whatever a unit of output is worth in your domain.
Most teams measure this one badly, and it carries the most weight in a mature engagement, so it repays the extra care.
Where each input misleads you
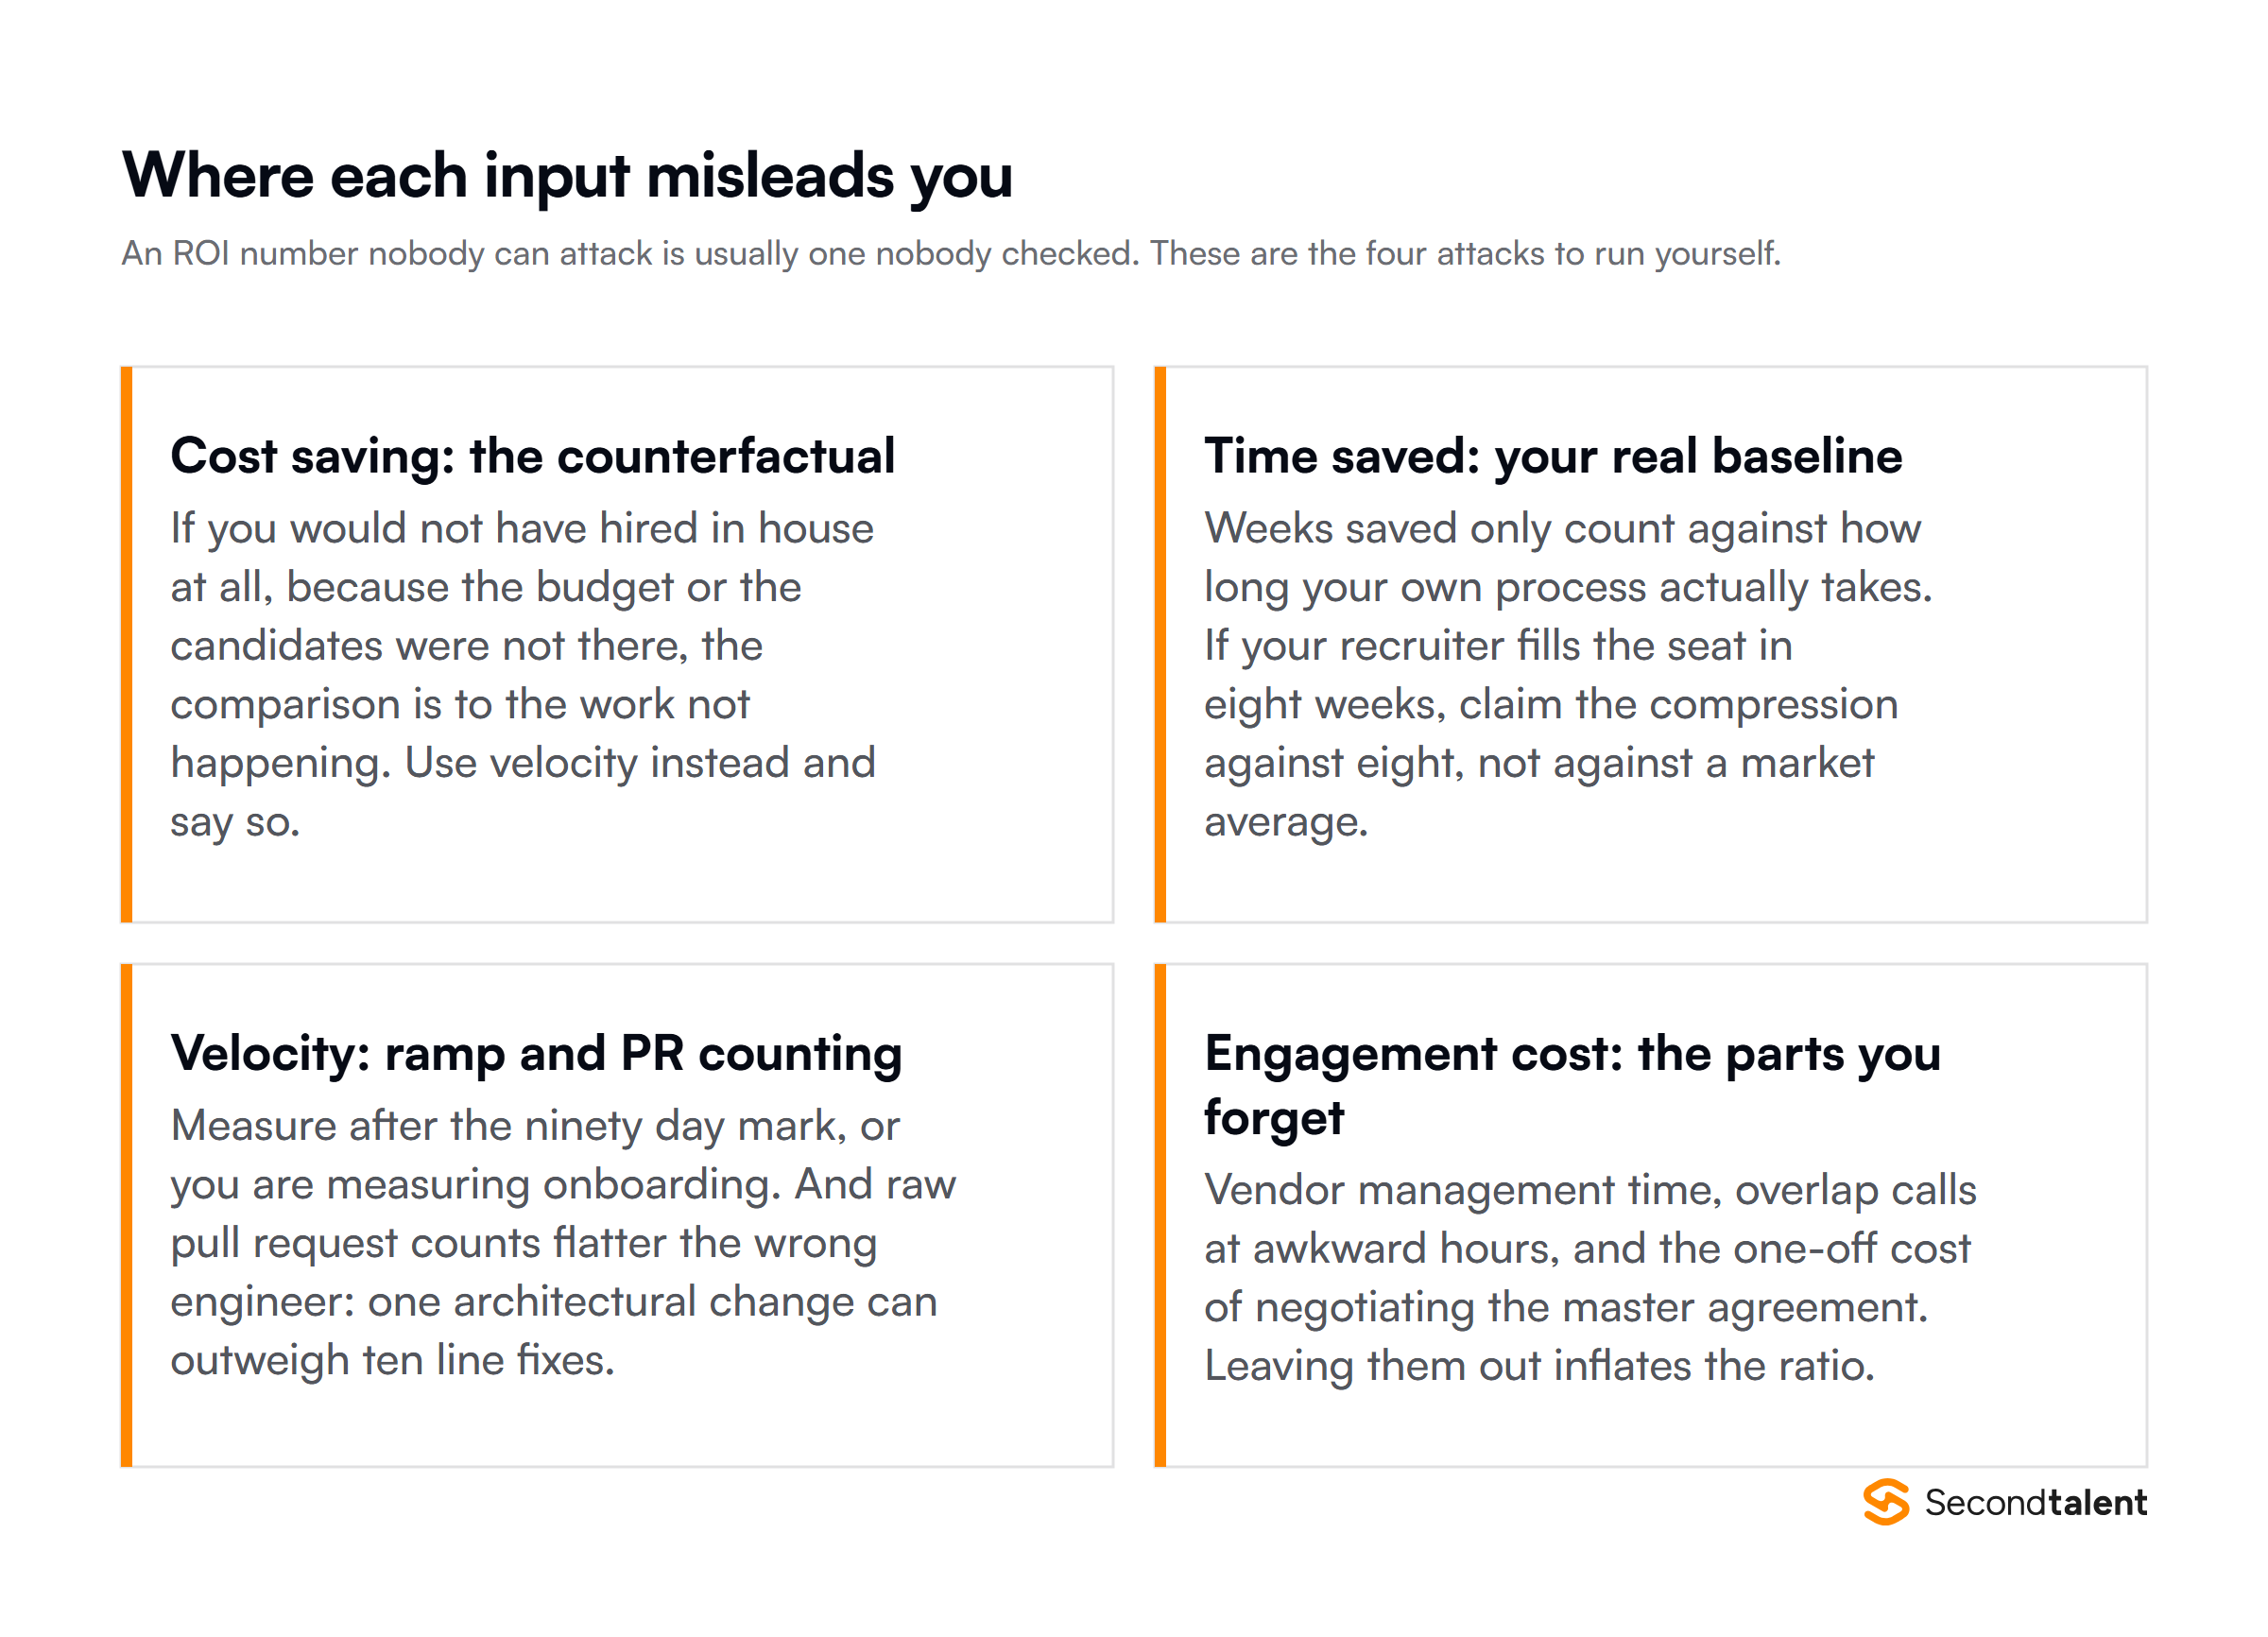
An ROI number nobody can attack is often one nobody checked. Run these four attacks on your own model first.
Cost saving assumes a counterfactual that may not hold. If you would not have made the in-house hire at all, because the budget did not exist or the search kept failing, then the comparison is against the work not happening. Cost saving becomes meaningless there, and velocity is the honest input to lead with.
Time saved is only worth your own baseline. Weeks saved count against how long your process actually takes, not against a market figure. If your recruiter fills that seat in eight weeks, claim the compression against eight.
Velocity measured during ramp measures onboarding. Output sits below baseline for the first weeks of any engagement while the engineer learns the codebase and the domain. Measure from the 90-day mark. Raw pull request counts also flatter the wrong engineer, since one architectural change can outweigh ten line fixes.
Engagement cost tends to be understated. Vendor management time, overlap calls at awkward hours, and the one-off cost of negotiating the master agreement are all real. Leaving them out inflates the ratio and gives a reviewer an easy way to dismiss it.
Pad the denominator on purpose. Overstating engagement cost costs you a few points of ROI and buys a number that survives scrutiny. A model that already includes the awkward line items is much harder to argue with than one that a reviewer gets to add them to.
Input 4: engagement cost
What you pay in total, fully loaded. This is the denominator, so err toward including things rather than excluding them.
Sum the provider fees, the management overhead you allocate to directing the engineer, incremental tooling and licences, and your own vendor-management time. The provider absorbs sourcing, vetting and HR administration, so this is lower than the equivalent in-house overhead, but it is not zero.
A worked example
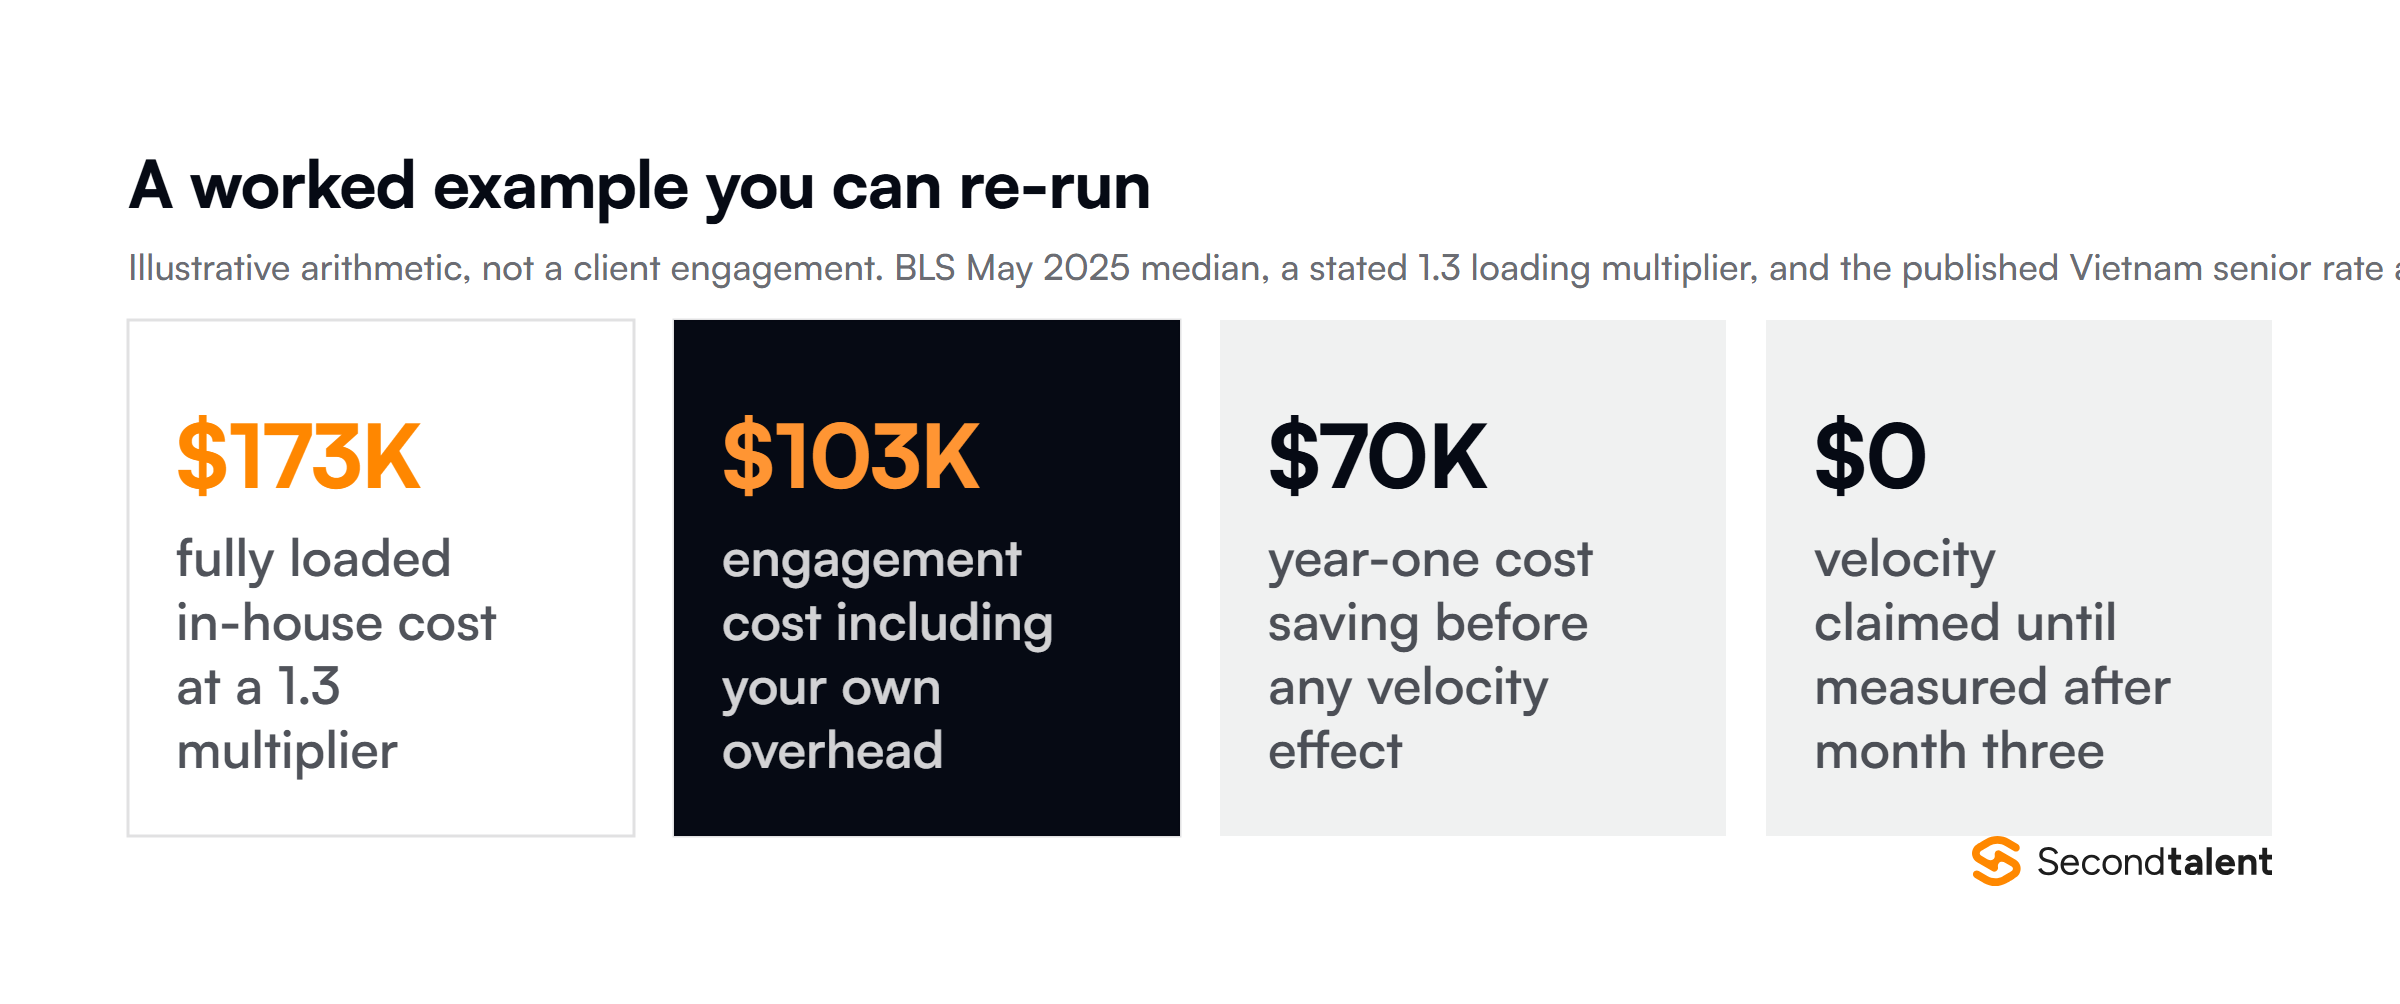
The arithmetic below is illustrative rather than a client engagement. Every input is a published figure or a stated assumption, so you can substitute your own and re-run it.
The in-house side. Take a senior software developer. BLS puts the May 2024 median at $135,980, salary only. Apply a loading multiplier of 1.3 for employer taxes, benefits, equipment and tooling, and the fully loaded figure is about $173,000. The multiplier is the assumption to argue with, and it is written down so a reviewer can.
The engagement side. A senior backend developer at the published Vietnam rate of $47.50 per hour, at 160 hours a month, is about $91,200 a year. Add $12,000 for your own management overhead, tooling and vendor-management time, and the engagement costs roughly $103,000.
Cost saving: about $70,000 in year one, before any velocity effect.
Time saved: if your own process takes 12 weeks and matched profiles arrive within 24 hours, you save most of a quarter of hiring-manager attention plus whatever the empty seat was blocking. Price both from your own numbers.
Velocity: leave it at zero until you have measured it after month three. A model that claims a velocity gain before the ramp has finished is claiming something it has not yet observed.
That gives a defensible year-one case on cost saving alone, with velocity as upside rather than as an assumption. It is a smaller number than the ones usually quoted for this category, and it is one that survives a finance review.
When does each benefit show up?
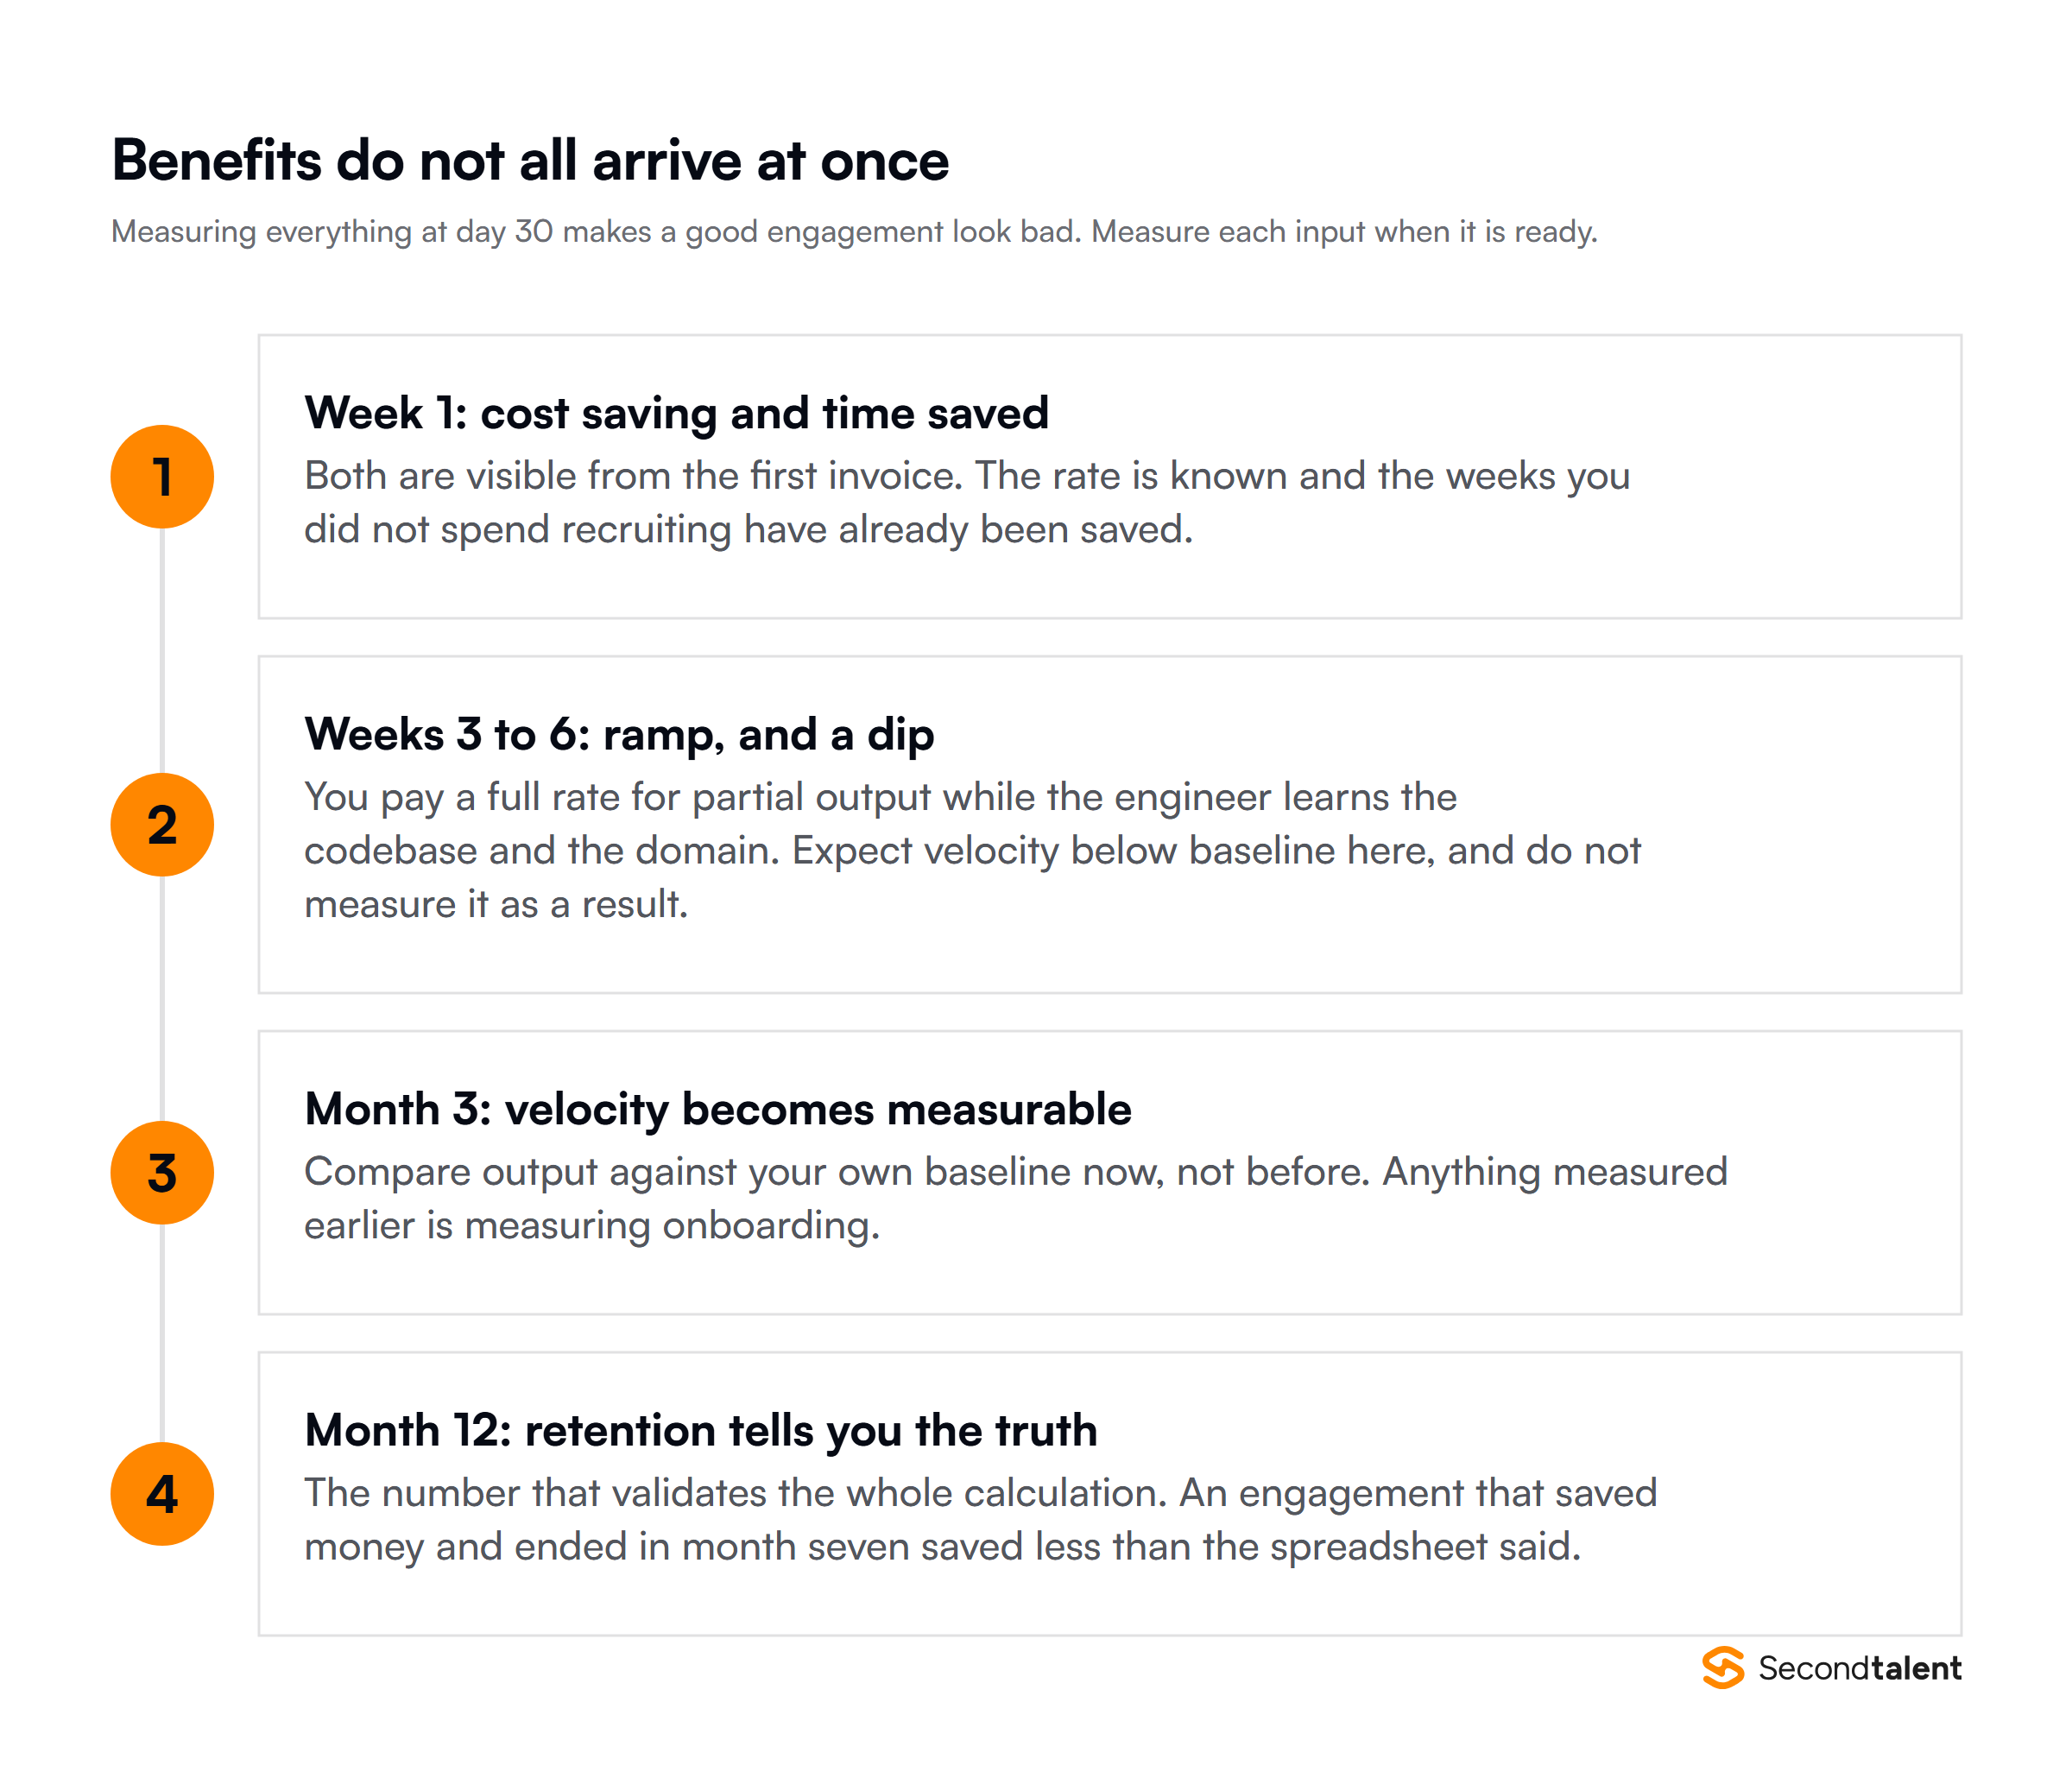
Measuring everything at day 30 makes a good engagement look like a bad one.
Cost saving and time saved are visible from the first invoice, because the rate is known and the recruiting weeks have already been avoided. Ramp comes next, and velocity sits below baseline for about three weeks on an ordinary product and longer in a regulated domain. Velocity becomes measurable at month three.
Retention at twelve months is what validates the whole calculation. An engagement that saved money and ended in month seven saved less than the spreadsheet claimed, once you count the replacement and the second ramp. Second Talent keeps 92 percent of placements in seat a year later, which is the figure worth asking any provider to supply.
What to put in the report
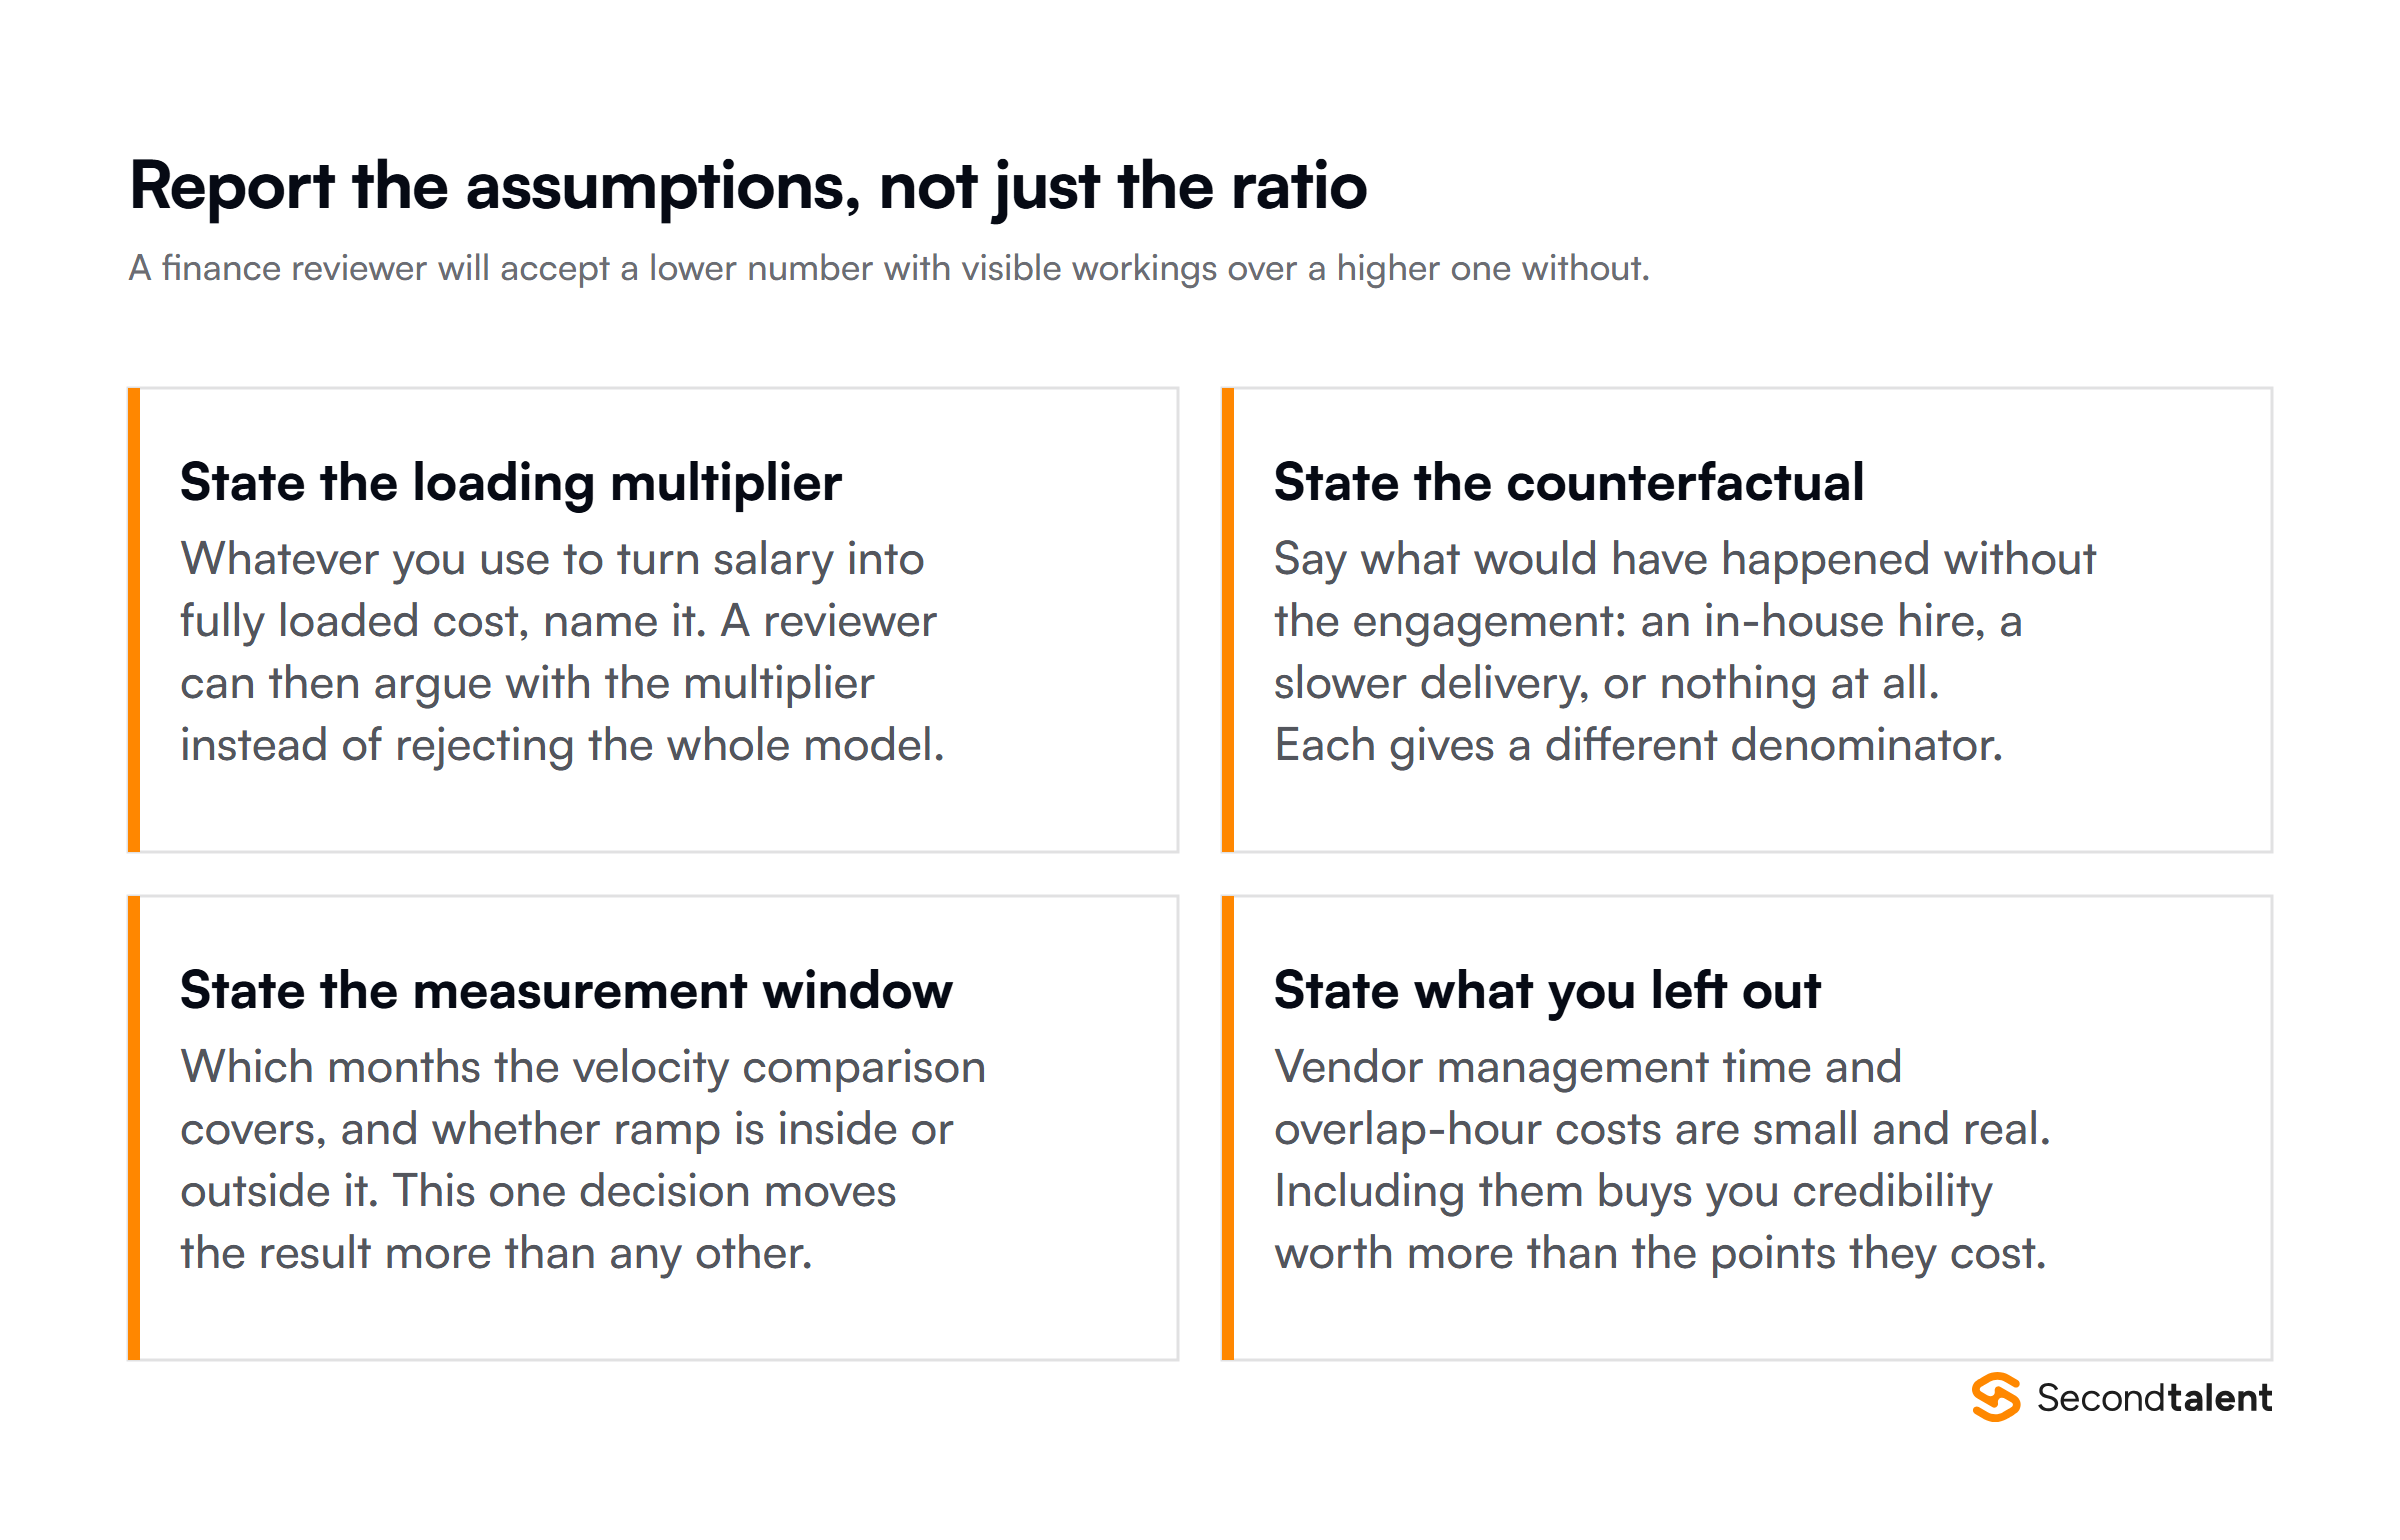
Report the assumptions alongside the ratio. Four disclosures do most of the work.
- The loading multiplier you used to turn salary into fully loaded cost.
- The counterfactual: an in-house hire, a slower delivery, or the work not happening.
- The measurement window for velocity, and whether ramp sits inside or outside it.
- What you left out, and why.
The third one moves the result more than any other single decision, so state it before someone asks.
Two risks that can wipe out the model
An ROI calculation assumes the engagement stays legal and stays on the books where you expected. Both assumptions can fail.
Misclassification. If the engagement is structured so that you direct a contractor rather than a provider-employed engineer, the exposure sits with you. The IRS common-law test weighs behavioural control, financial control and the type of relationship, and a person on your hours and systems under your direction scores as an employee on most factors. Back taxes and penalties do not appear anywhere in a rate comparison, and they are large enough to invert one.
Confirm which legal entity employs the engineer before you model anything. Our guide to worker classification in cross-border IT staffing covers where the structure breaks.
Accounting treatment. Where the work is a defined build rather than ongoing capacity, some of it may be capitalised rather than expensed, under ASC 350-40 in the US or IAS 38 under IFRS. That changes which budget the cost lands in and how the return gets reported, so agree the treatment with finance before you present a ratio built on the other assumption.
Neither risk argues against the model. Both argue for running your numbers past the two people who will find them: whoever owns employment compliance, and whoever owns the ledger.
IT staffing ROI FAQs
What is a realistic ROI to expect?
Ask for the inputs rather than the headline. A ratio quoted without a counterfactual, a measurement window and a loading multiplier cannot be compared against anything, including your own engagement.
How long before ROI turns positive?
Cost saving starts at the first invoice, so the ratio is often positive from month one on that input alone. The number worth waiting for is the one that includes velocity, which needs the ramp behind it.
Should ROI include the cost of a failed placement?
Yes, if one happened. Include the wasted ramp, the replacement search and the second ramp. A model that quietly drops failures is measuring your luck rather than the provider.
How do we measure velocity without a clean baseline?
Use the same team before and after rather than comparing two different teams. Pre-engagement throughput for your own squad is a better control than an industry benchmark you cannot verify.
Takeaways
- Four inputs: cost saving, time saved, velocity gain, engagement cost.
- Start the in-house baseline from a published median and name your loading multiplier.
- Measure velocity from month three. Anything earlier measures onboarding.
- Pad the denominator. Credibility is worth more than the points it costs.
- Retention at twelve months validates the whole calculation.
Build the case with real numbers
Second Talent publishes the rates, the retention figure and the case studies behind these calculations, so your model can cite something a reviewer can open.
Tell us which seat you need to fill, or read how to evaluate IT staffing companies before you commit to a provider.