TL;DR: A modern IT staffing vetting funnel runs four stages: application screen, technical assessment, AI tooling fluency and behavioural. Each stage exists to catch something the one before it cannot. When you evaluate a provider, ask for the drop rate at each stage rather than the size of the talent pool, and ask for retention on placed engineers rather than a claim about the top one percent. A provider who will not share stage data has given you the answer.
The vetting funnel decides whether you get a senior engineer or a relabelled mid-level CV. It also decides whether a 24-hour matching promise is real or a marketing line, because a provider can only move that fast if the work happened before you called. This guide covers what each stage does, what it catches, and how to read a funnel report during vendor selection.

What is a vetting funnel?
A vetting funnel is the sequence of filters a staffing provider runs between an incoming application and a placeable engineer.
The useful thing about a funnel is its shape rather than its width. Two providers can each claim a pool of 27,000 engineers and deliver different outcomes, because the number that matters is how many people each stage rejects and why.
That makes the funnel the right thing to interrogate during procurement. A pool size tells you about marketing. A drop rate tells you about standards.
Stage one: the application screen
The cheapest filter runs first, and it does three jobs at once.
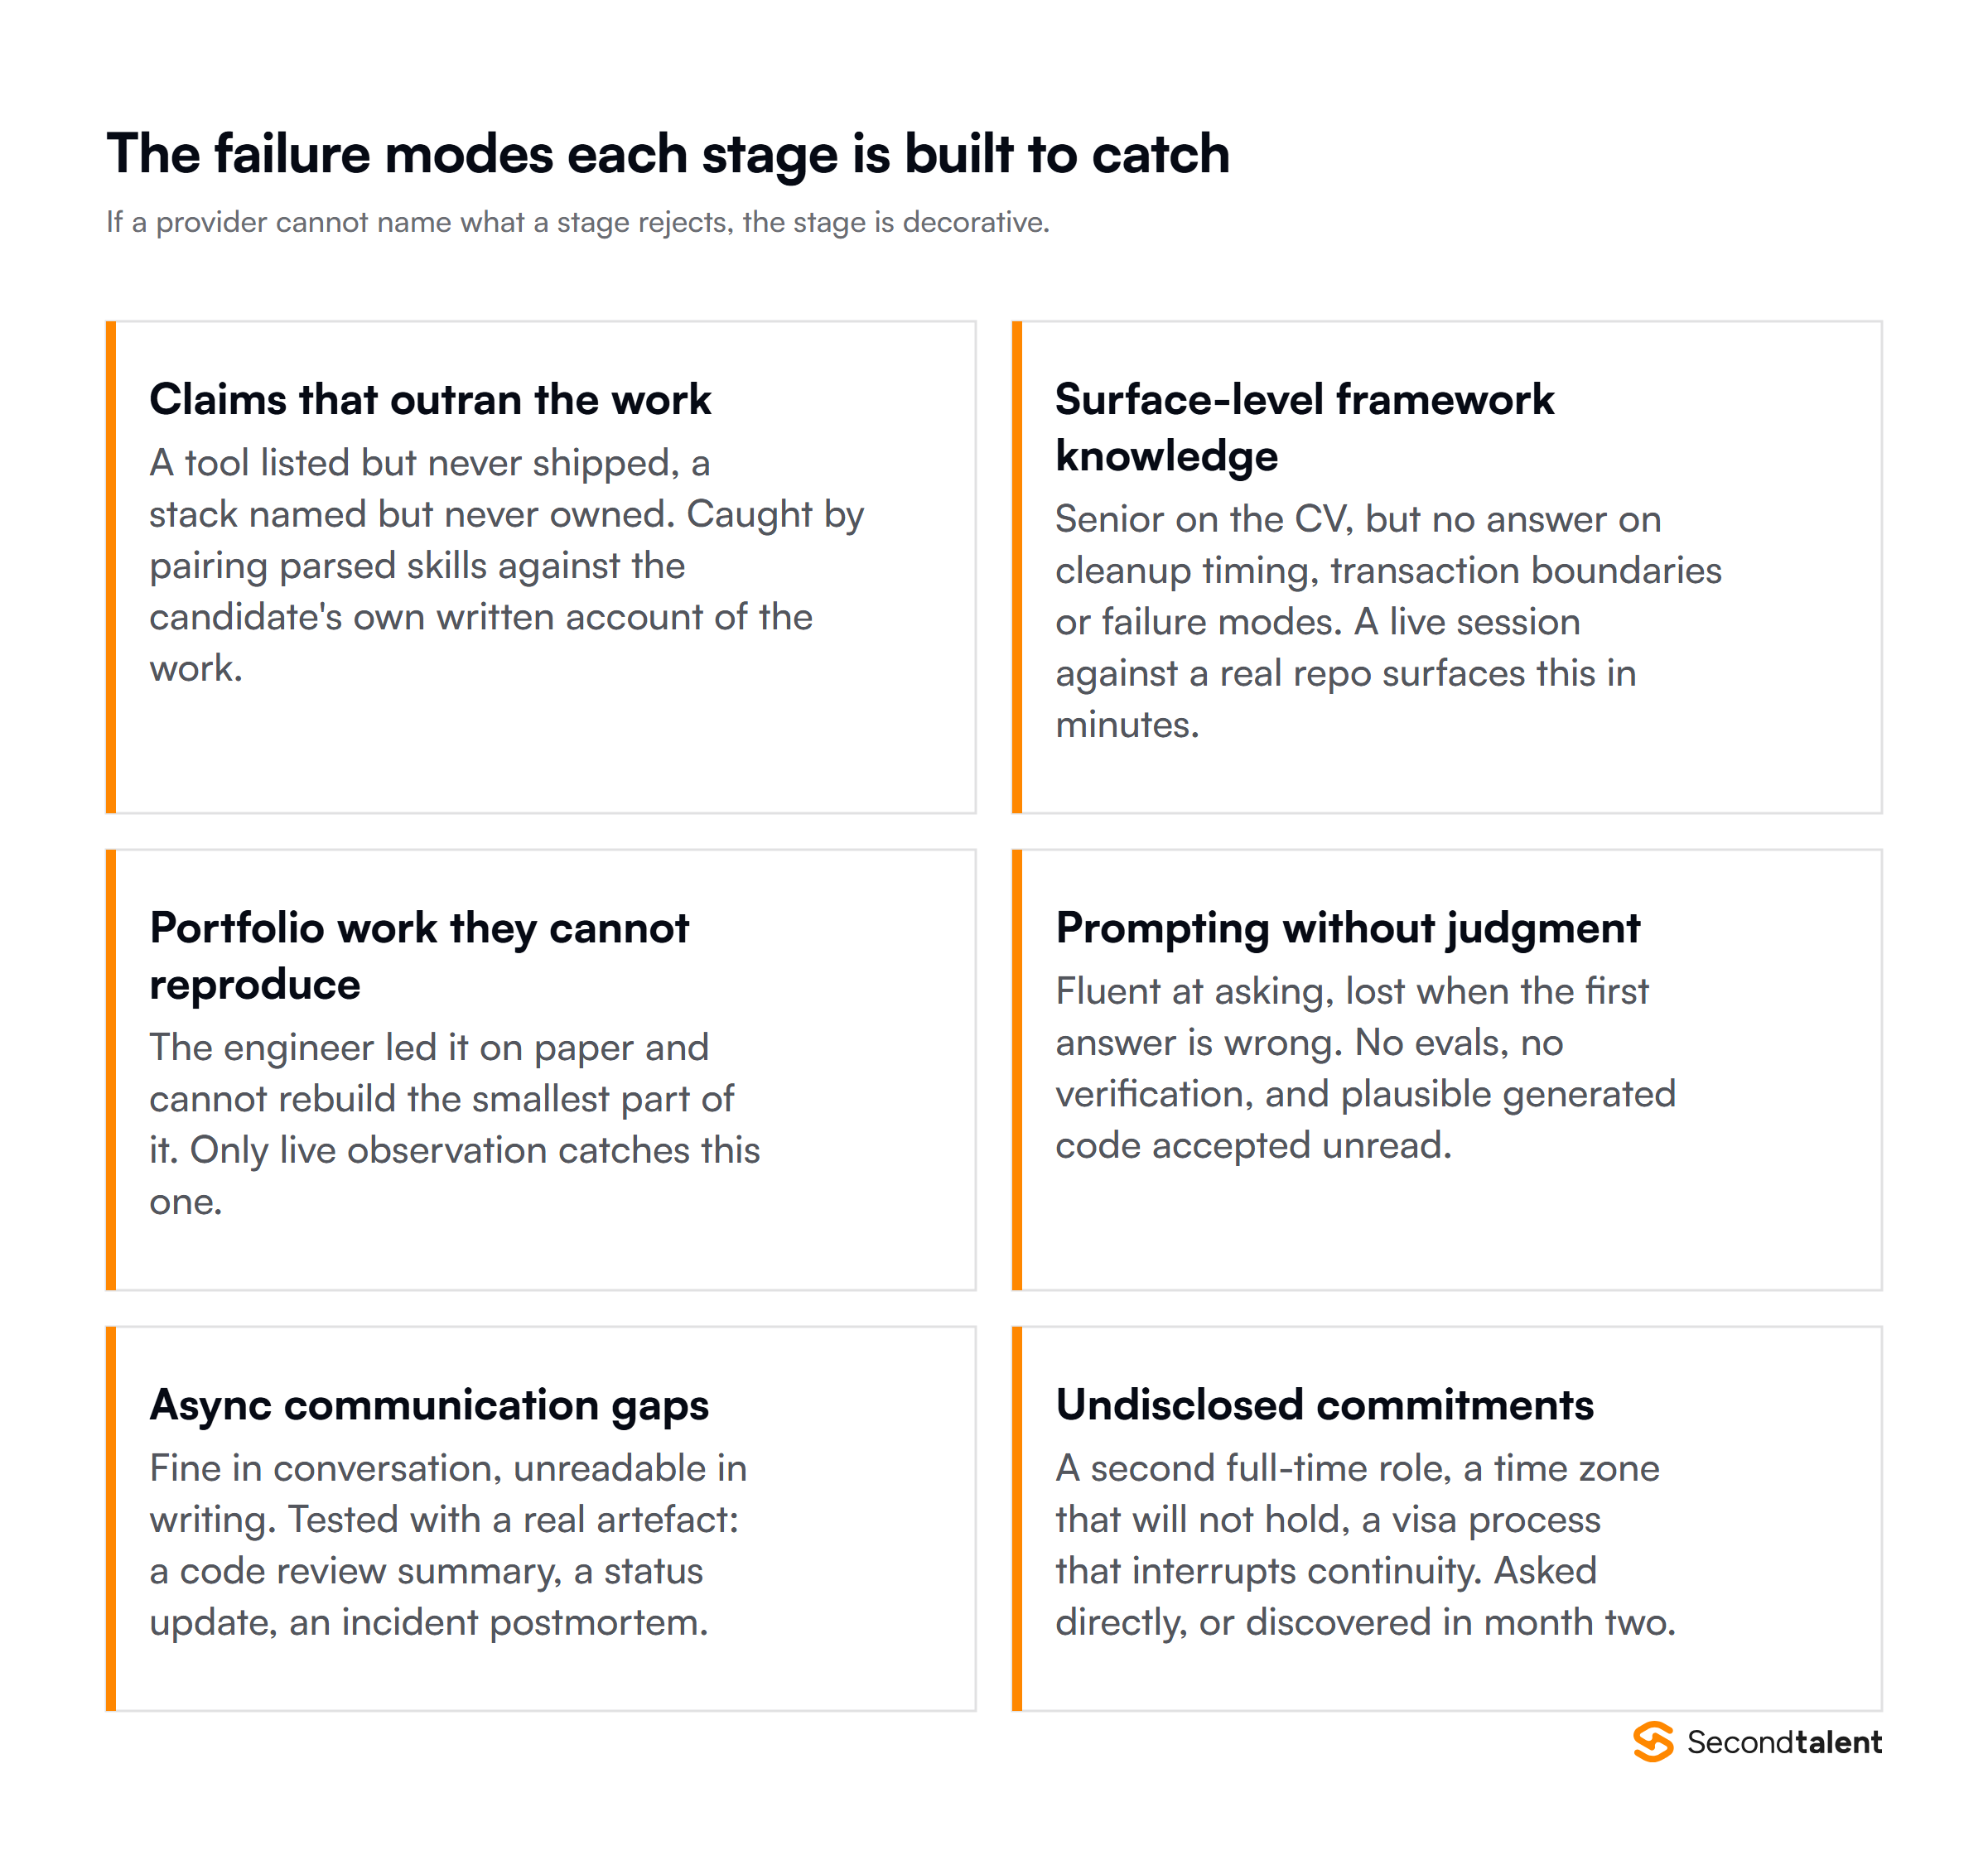
Role match. Automated parsing pulls skills, seniority, recent roles and stack depth from the CV. Parsing alone is weak, because it reads claims rather than evidence, so a good screen pairs it with the candidate’s own written account of what they built and owned.
Written English. Distributed engineering runs on async writing. A short written answer, scored by a person, predicts async fit better than a later phone call does.
Right to work. Residency, work authorisation and tax status get checked before anyone spends time on a technical session. In EOR-managed engagements this matters more, because a compliance problem traces back to the contracting entity.
The screen is where cost discipline lives. Each candidate who reaches a live technical session costs the provider real engineering hours. A provider whose screen is thin pushes that cost downstream, then either absorbs it in margin or passes weaker candidates through to fill the shortlist on time.
Stage two: the technical assessment
A live session against a real repository, running 90 to 120 minutes across three parts: build a feature, design a system, then talk through the specific frameworks named on the CV.
The format matters more than the questions. An engineer reasoning out loud against live code is harder to coach or fake than one solving a static puzzle, and the conversation exposes depth that a passing score hides.
Three failure modes surface here. Surface-level framework knowledge, where a candidate claims senior and has no answer on cleanup timing or transaction boundaries. Stack inflation, where a named database turns out to be generic SQL underneath. And portfolio work the candidate cannot reproduce even in outline.
Ask one question about how the bar is set. A fixed bar passes whoever clears a defined line. A relative bar passes whoever is best this week, which means your hire quality moves with the provider’s application volume rather than with your requirements.
Stage three: AI tooling fluency
This stage is the newest, and the case for it comes from how ordinary the tools have become.
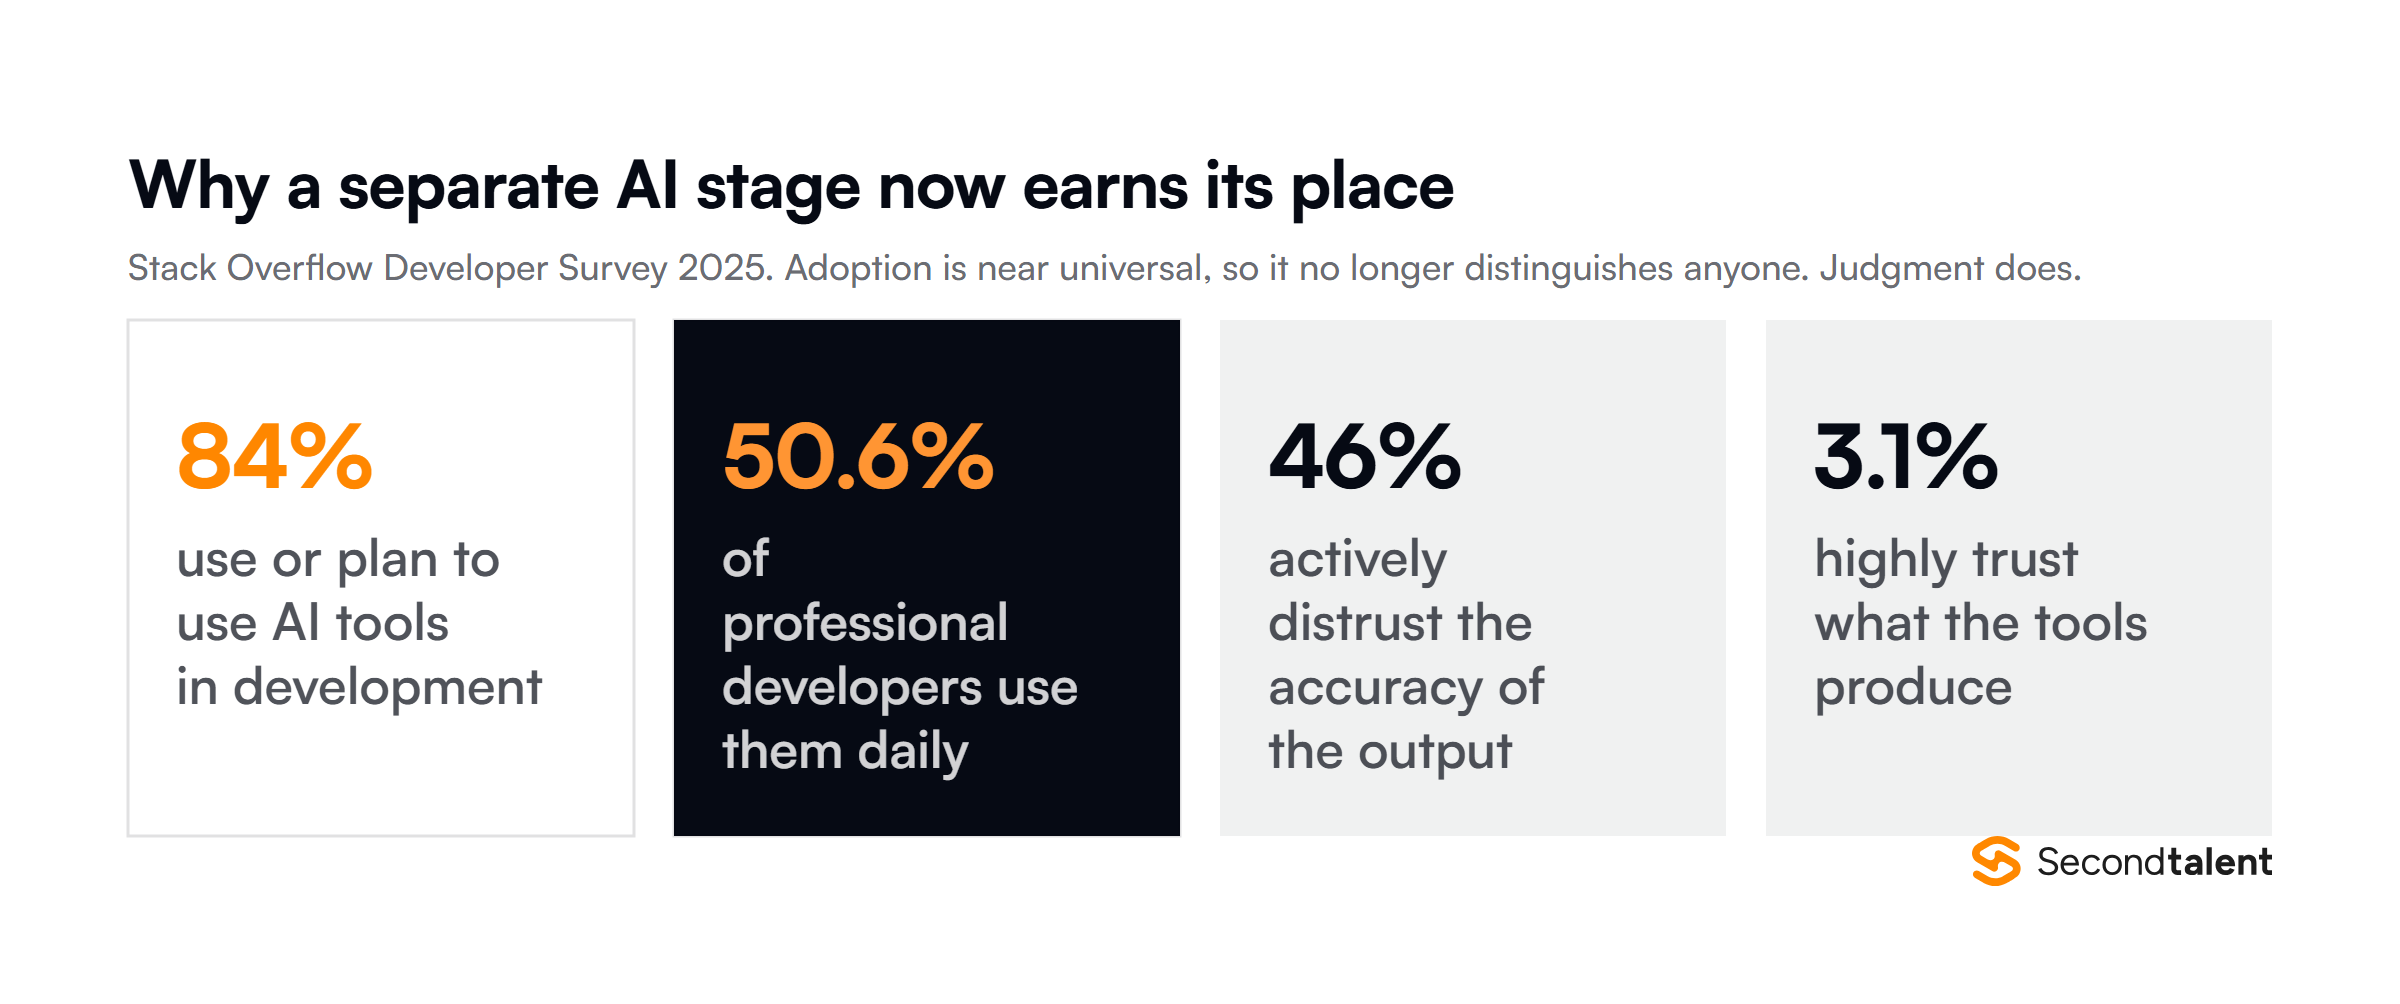
The 2025 Stack Overflow Developer Survey found 84 percent of respondents use or plan to use AI tools, up from 76 percent a year earlier, with 50.6 percent of professional developers using them daily. Tool exposure no longer separates candidates, so a CV listing Cursor or Claude Code carries close to zero signal.
Judgment is what separates them. The same survey found 46 percent of developers distrust the accuracy of what these tools produce against 33 percent who trust it, and 3.1 percent put themselves in the highest trust band. Developers with ten or more years of experience are the most sceptical of all.
So the stage tests behaviour rather than familiarity: watch the engineer iterate a prompt after the first answer comes back wrong, write an eval for an LLM-backed feature, and debug generated code instead of accepting it because it looks plausible. A 60-minute observed session settles it, and a CV cannot.
Ask any provider claiming AI-native engineers to show you the written rubric. Without published criteria, nobody can check the claim. Our companion guide on AI-native skills assessment covers the test design.
Stage four: the behavioural assessment
The last stage tests three things a technical screen leaves untouched.
Conflict and ambiguity. Structured questions about disagreeing with a tech lead, working from a thin spec, or owning a missed deadline. Strong answers carry concrete examples and reflection. Weak answers stay abstract.
Written async communication. Tested with a real artefact rather than a conversation: a code review summary, a status update on a stalled task, a postmortem. Clarity and completeness are the signal, not grammar.
Undisclosed commitments. A second full-time role, a time zone that will not hold, a visa process that will interrupt continuity. A provider who asks these questions outright saves you a replacement cycle in month two.
Who is looking after the candidate data?
A vetting funnel is a large personal-data pipeline, and that question belongs in your diligence alongside the quality ones.
CVs, assessment recordings, right-to-work documents and reference notes are all personal data. Where candidates or the provider sit in the EU or UK, GDPR governs how long that material may be kept and on what basis, and European Data Protection Board guidance covers transfers outside the EEA, which is the normal case for an offshore funnel.
Two questions cover most of it: how long does the provider retain assessment recordings for candidates they reject, and which countries does that data move through? A provider who has thought about the funnel as a data pipeline answers both without checking.
Where funnel depth matters most
Rigour costs money, so it pays off unevenly. It matters most in the specialties where local supply is thin and a bad hire is expensive to unwind.
The US Bureau of Labor Statistics projects data scientist employment to grow 34 percent between 2024 and 2034 and information security analysts 29 percent, against about 4 percent across all occupations. Those are the roles where a shallow funnel shows up as three months of failed shortlists.
For a common seat with deep local supply, a lighter funnel and your own screen may serve you fine. Match the diligence to the scarcity rather than applying one standard to every role.
How do you read a provider’s funnel report?
Ask for five numbers per stage: applications entering, drop rate, time in stage, top failure modes, and acceptance rate into the next stage.
Then look for six things that should slow the conversation down.
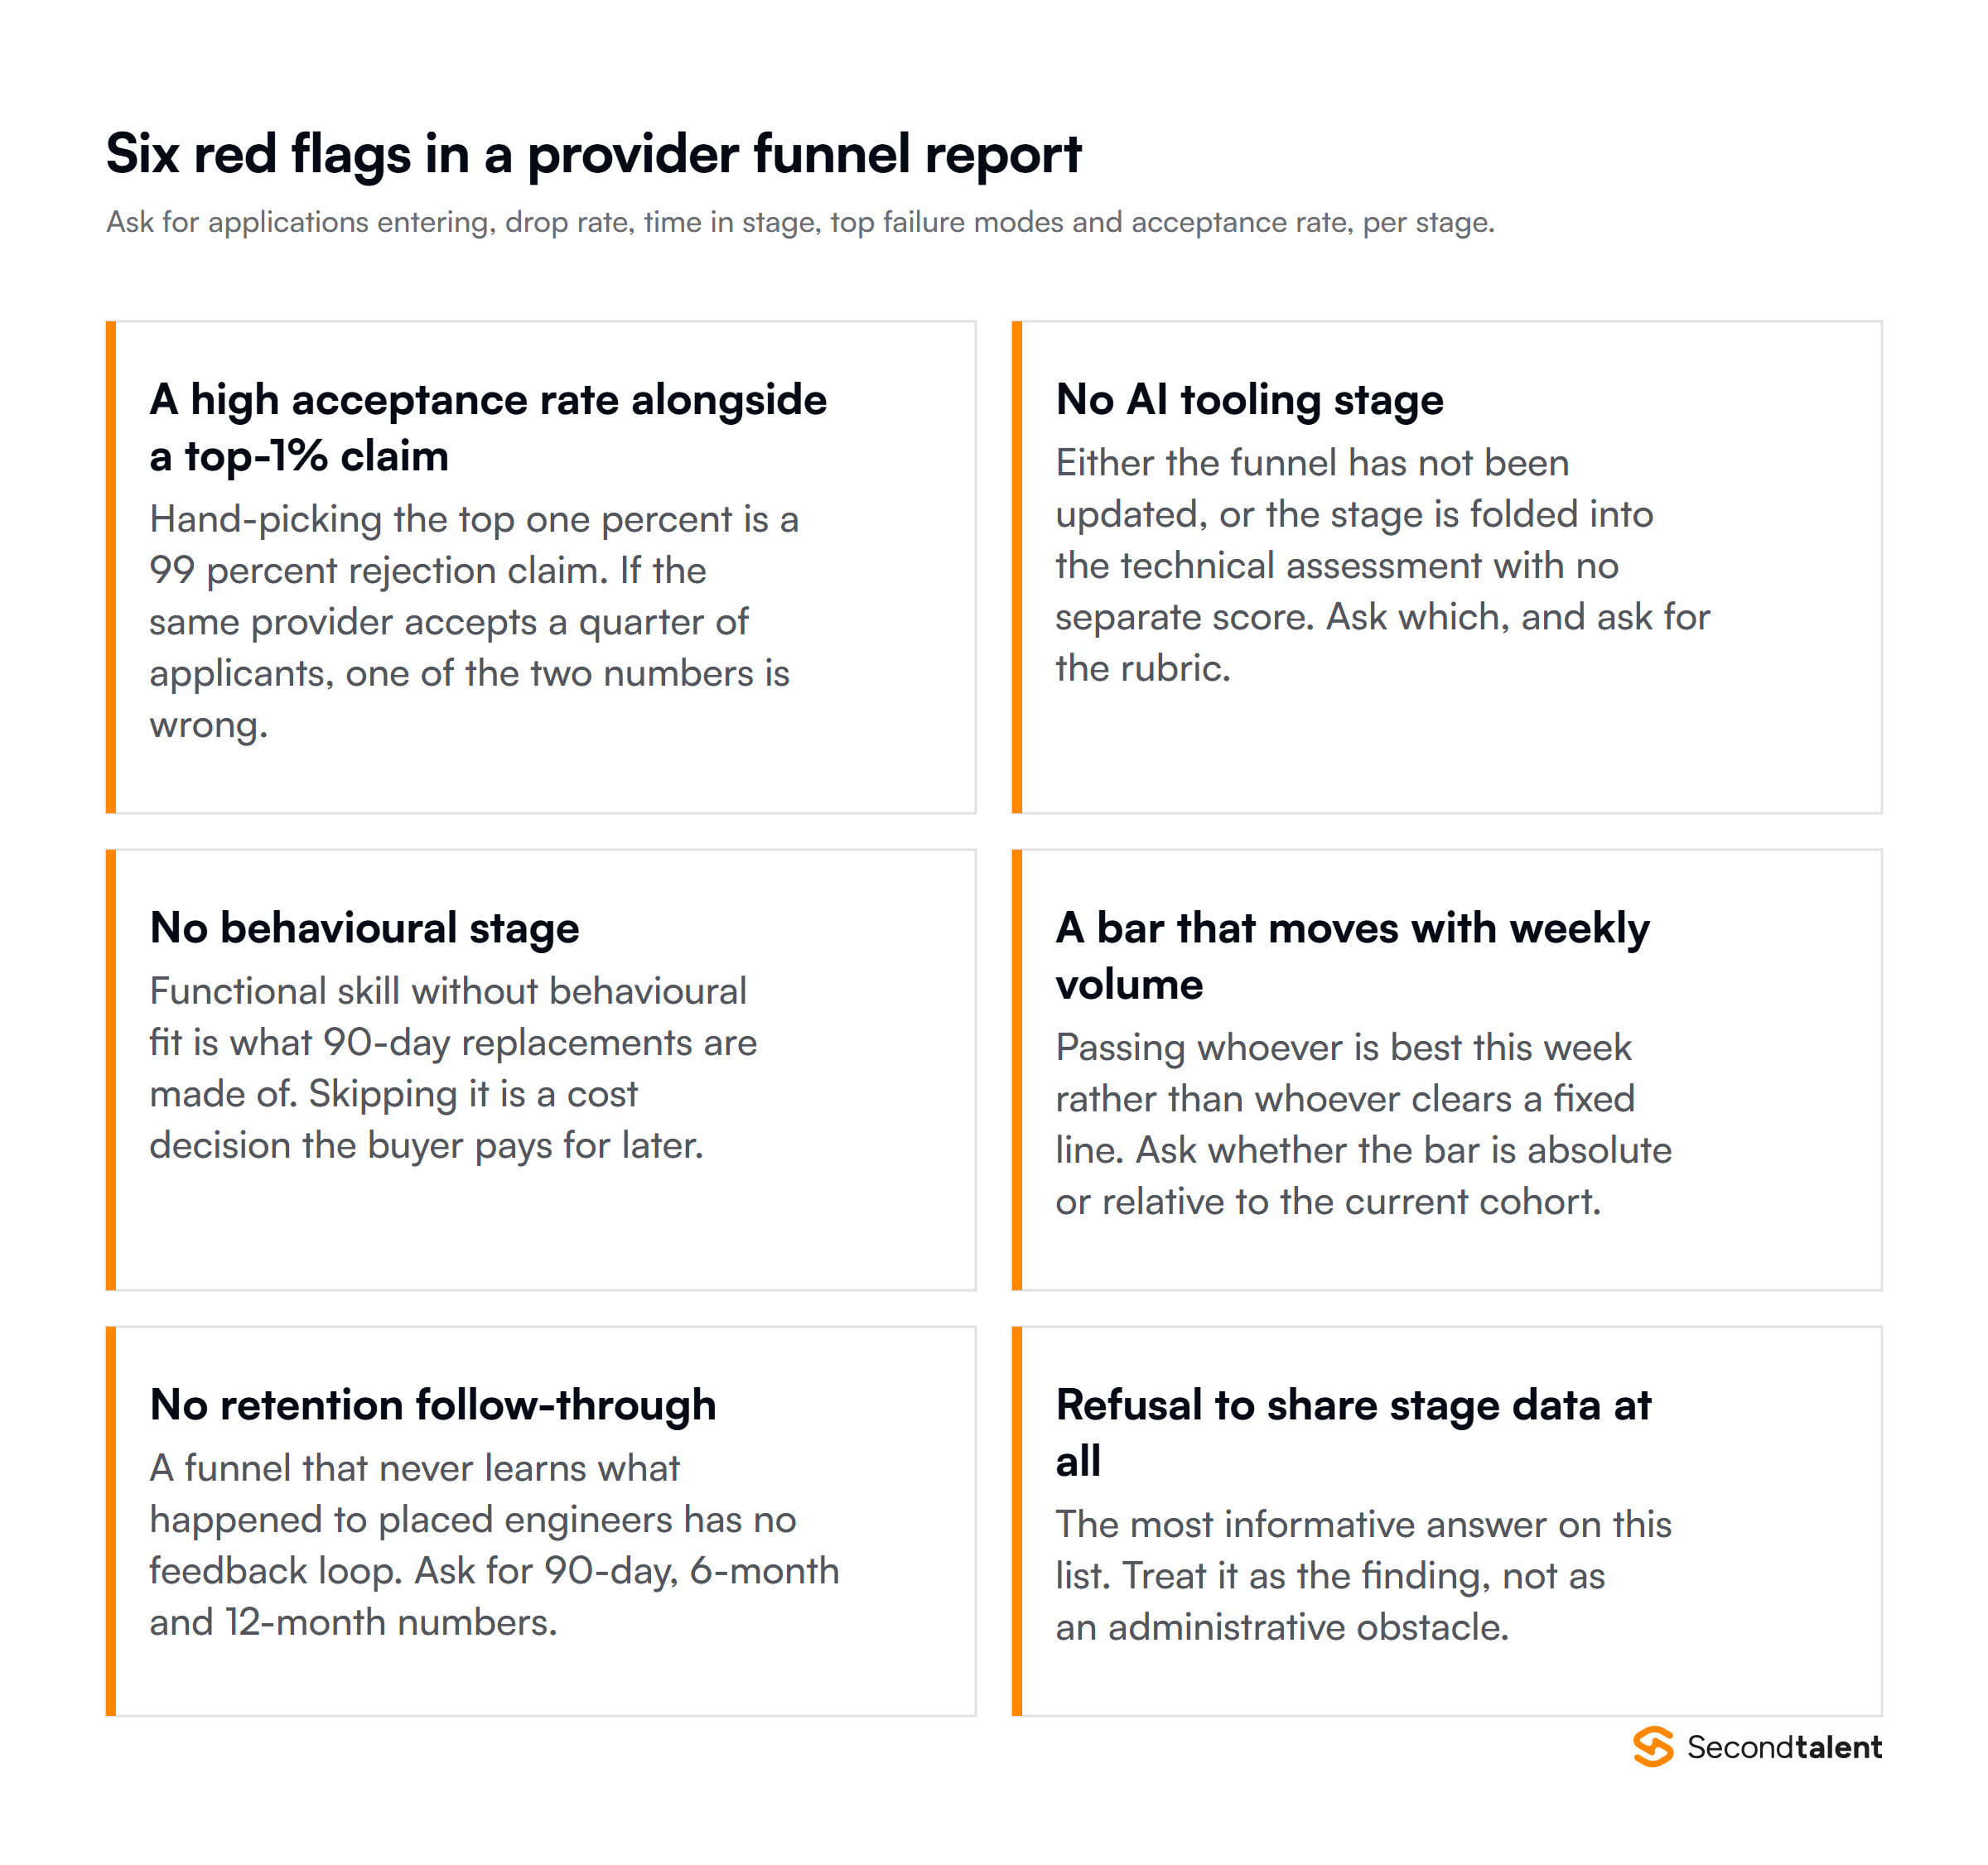
A top-1% claim beside a high acceptance rate. Hand-picking the top one percent is a 99 percent rejection claim. If the same provider accepts a quarter of applicants, one of those two numbers is wrong.
No AI tooling stage. Either the provider has not updated the funnel, or they fold the stage into the technical assessment with no separate score. Ask which, then ask for the rubric.
No behavioural stage. Functional skill without behavioural fit drives most 90-day replacements.
A bar that moves with volume. Ask whether the technical bar is absolute or relative to the current cohort.
No retention follow-through. A funnel that does not learn what happened to placed engineers has no feedback loop, so nothing improves.
Refusal to share stage data. Treat that as the finding rather than as an administrative obstacle.
What to ask in the vendor call
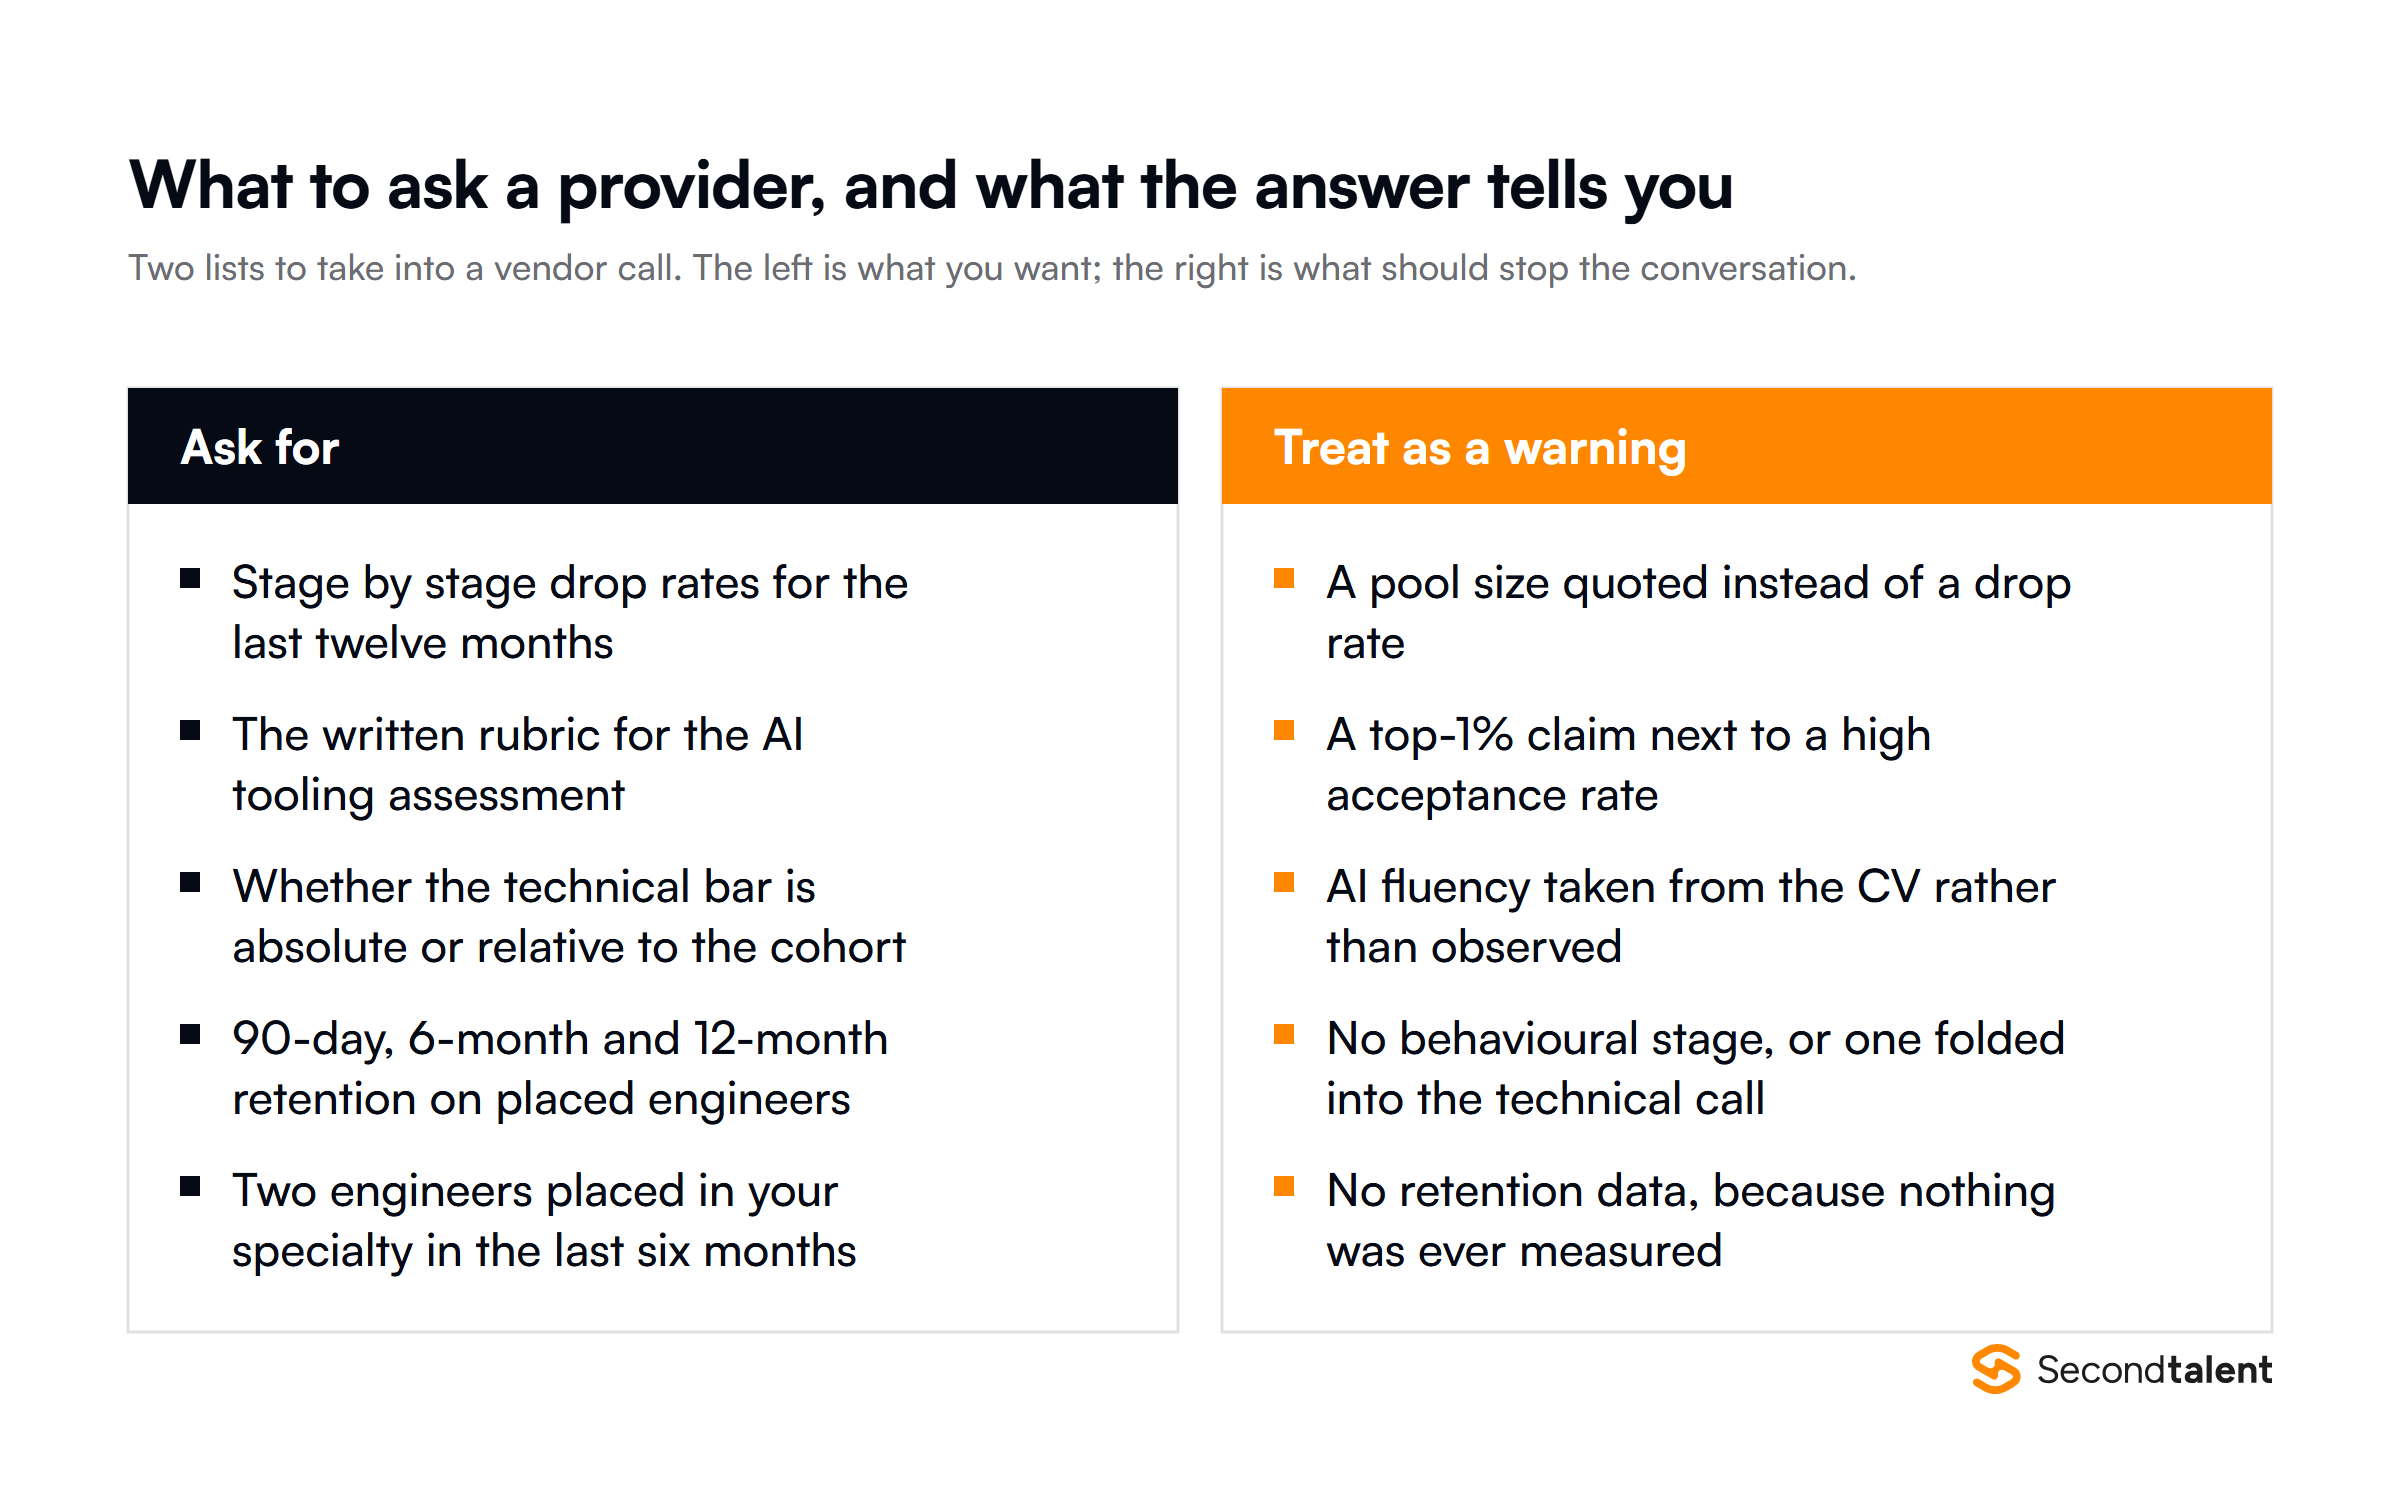
Five requests turn this into a 20-minute conversation you can run without a procurement template.
- Stage-by-stage drop rates for the last twelve months.
- The written rubric for the AI tooling assessment.
- Whether the technical bar is absolute or relative to the cohort.
- Retention on placed engineers at 90 days, six months and twelve months.
- Two engineers placed in your specialty within the last six months.
The retention question does the most work. A provider who has measured it will answer in a sentence, and one who has not will explain why the question is hard to answer. Our checklist on how to evaluate IT staffing companies and the 15 questions to ask before signing extend this into a full evaluation.
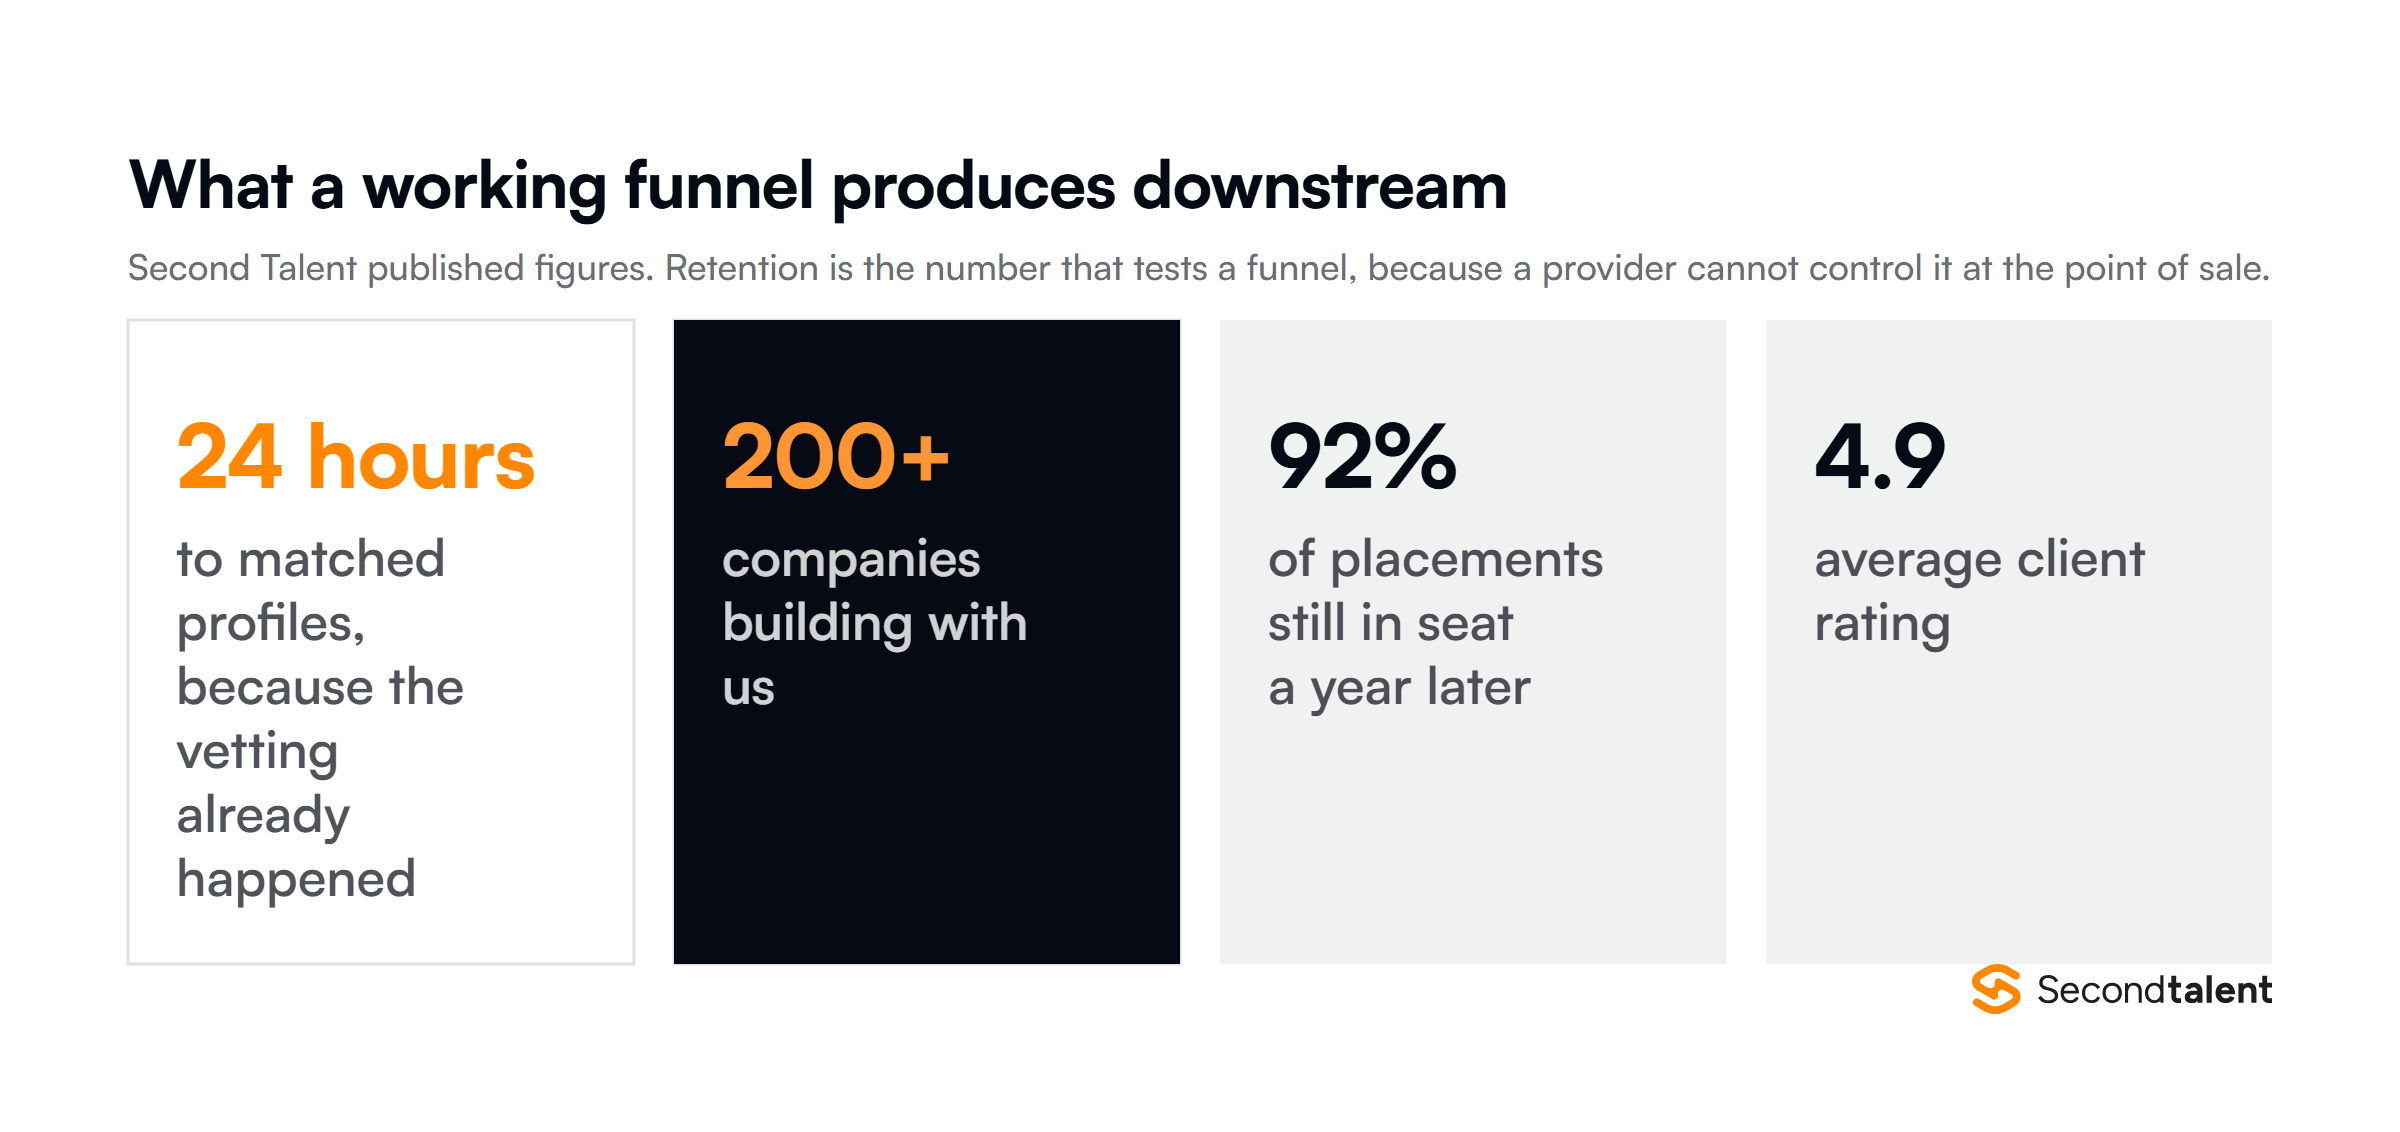
What a working funnel produces
Speed downstream is the visible result of depth upstream. Second Talent returns matched profiles within 24 hours because the vetting already happened, not because the search is fast.
Across placements, 92 percent are still in seat a year later, against an average client rating of 4.9 and more than 200 companies building with us.
Retention is the number that tests a funnel, because it is the only one the provider cannot control at the point of sale. Everything upstream is a claim until placed engineers stay.
Vetting funnel FAQs
Should I run my own technical screen as well?
Yes. Keep one focused session of your own whatever the provider’s rigour. It is the cheapest insurance available, and it tests fit against your codebase rather than against a general bar.
What acceptance rate should I expect from a quality provider?
Ask for the number rather than assuming one. What matters is whether the rate is consistent with the provider’s other claims and whether they can show the drop at each stage.
Does a bigger talent pool mean better matching?
No. What matters is the slice that fits your role and clears the bar. A large pool with shallow filtering produces more names and weaker signal per name.
How long should vetting take?
For the provider, it should run without pause, well before you call. If vetting starts when you raise a requirement, the provider is running a search rather than a funnel, and the timeline shows it.
Takeaways
- Ask for drop rates per stage, not pool size. Shape beats width.
- AI tool exposure is now near universal, so test judgment about the output instead.
- A fixed technical bar protects you from the provider’s weekly application volume.
- Retention at 12 months is the one number a provider cannot fake at the point of sale.
- Refusal to share stage data is itself the answer.
See the funnel in practice
Second Talent runs an always-on funnel across Asia, which is why matched profiles arrive within 24 hours and 92 percent of placements are still in seat a year later.
Tell us which seat you need to fill, or read what IT staffing is for the engagement models behind the placement.