TL;DR: The IT staffing market is around $127.75 billion in 2026, growing at 3.61 percent a year to 2031, with North America the largest demand region at 44 percent of revenue and Asia Pacific the fastest-growing at 8.15 percent. If you have seen a figure near half a trillion for this market, that describes staffing across every discipline rather than the IT segment, and the error propagates into every share and growth calculation built on it.
This is the macro view. It complements what IT staffing is, which covers definitions, and why companies use IT staffing, which covers buyer motivation.
How big is the IT staffing market?
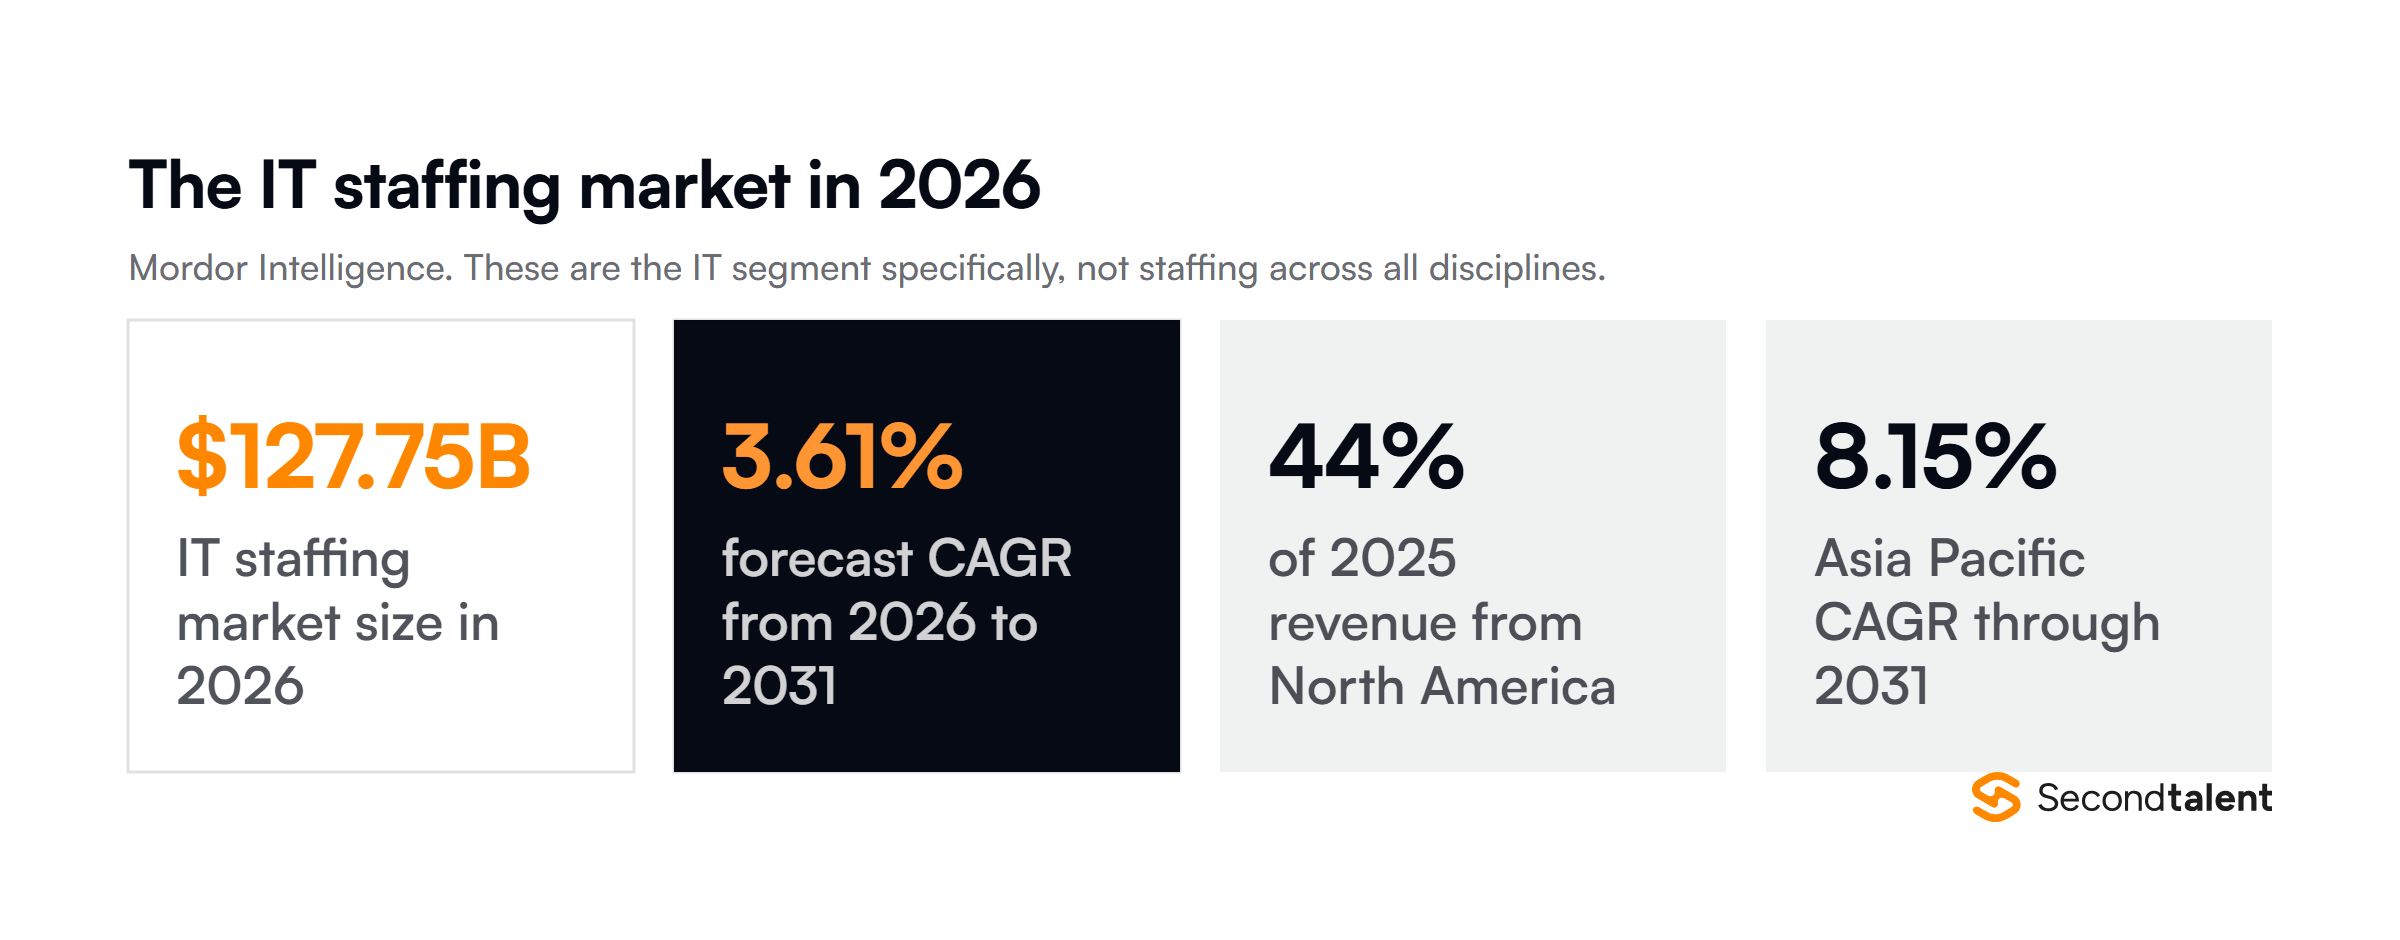
Mordor Intelligence puts it at $123.30 billion in 2025 and $127.75 billion in 2026, forecast to reach $152.47 billion by 2031 at a 3.61 percent compound annual rate.
North America produced 44.05 percent of 2025 revenue. Large enterprises accounted for 70.80 percent of spend. Asia Pacific is the fastest-growing region at 8.15 percent a year through 2031.
That describes a mature market growing at a modest rate in aggregate, with the growth concentrated by region and specialty rather than spread evenly. It is a less dramatic picture than this category usually paints, and it is the one the data supports.
The sizing error you will encounter
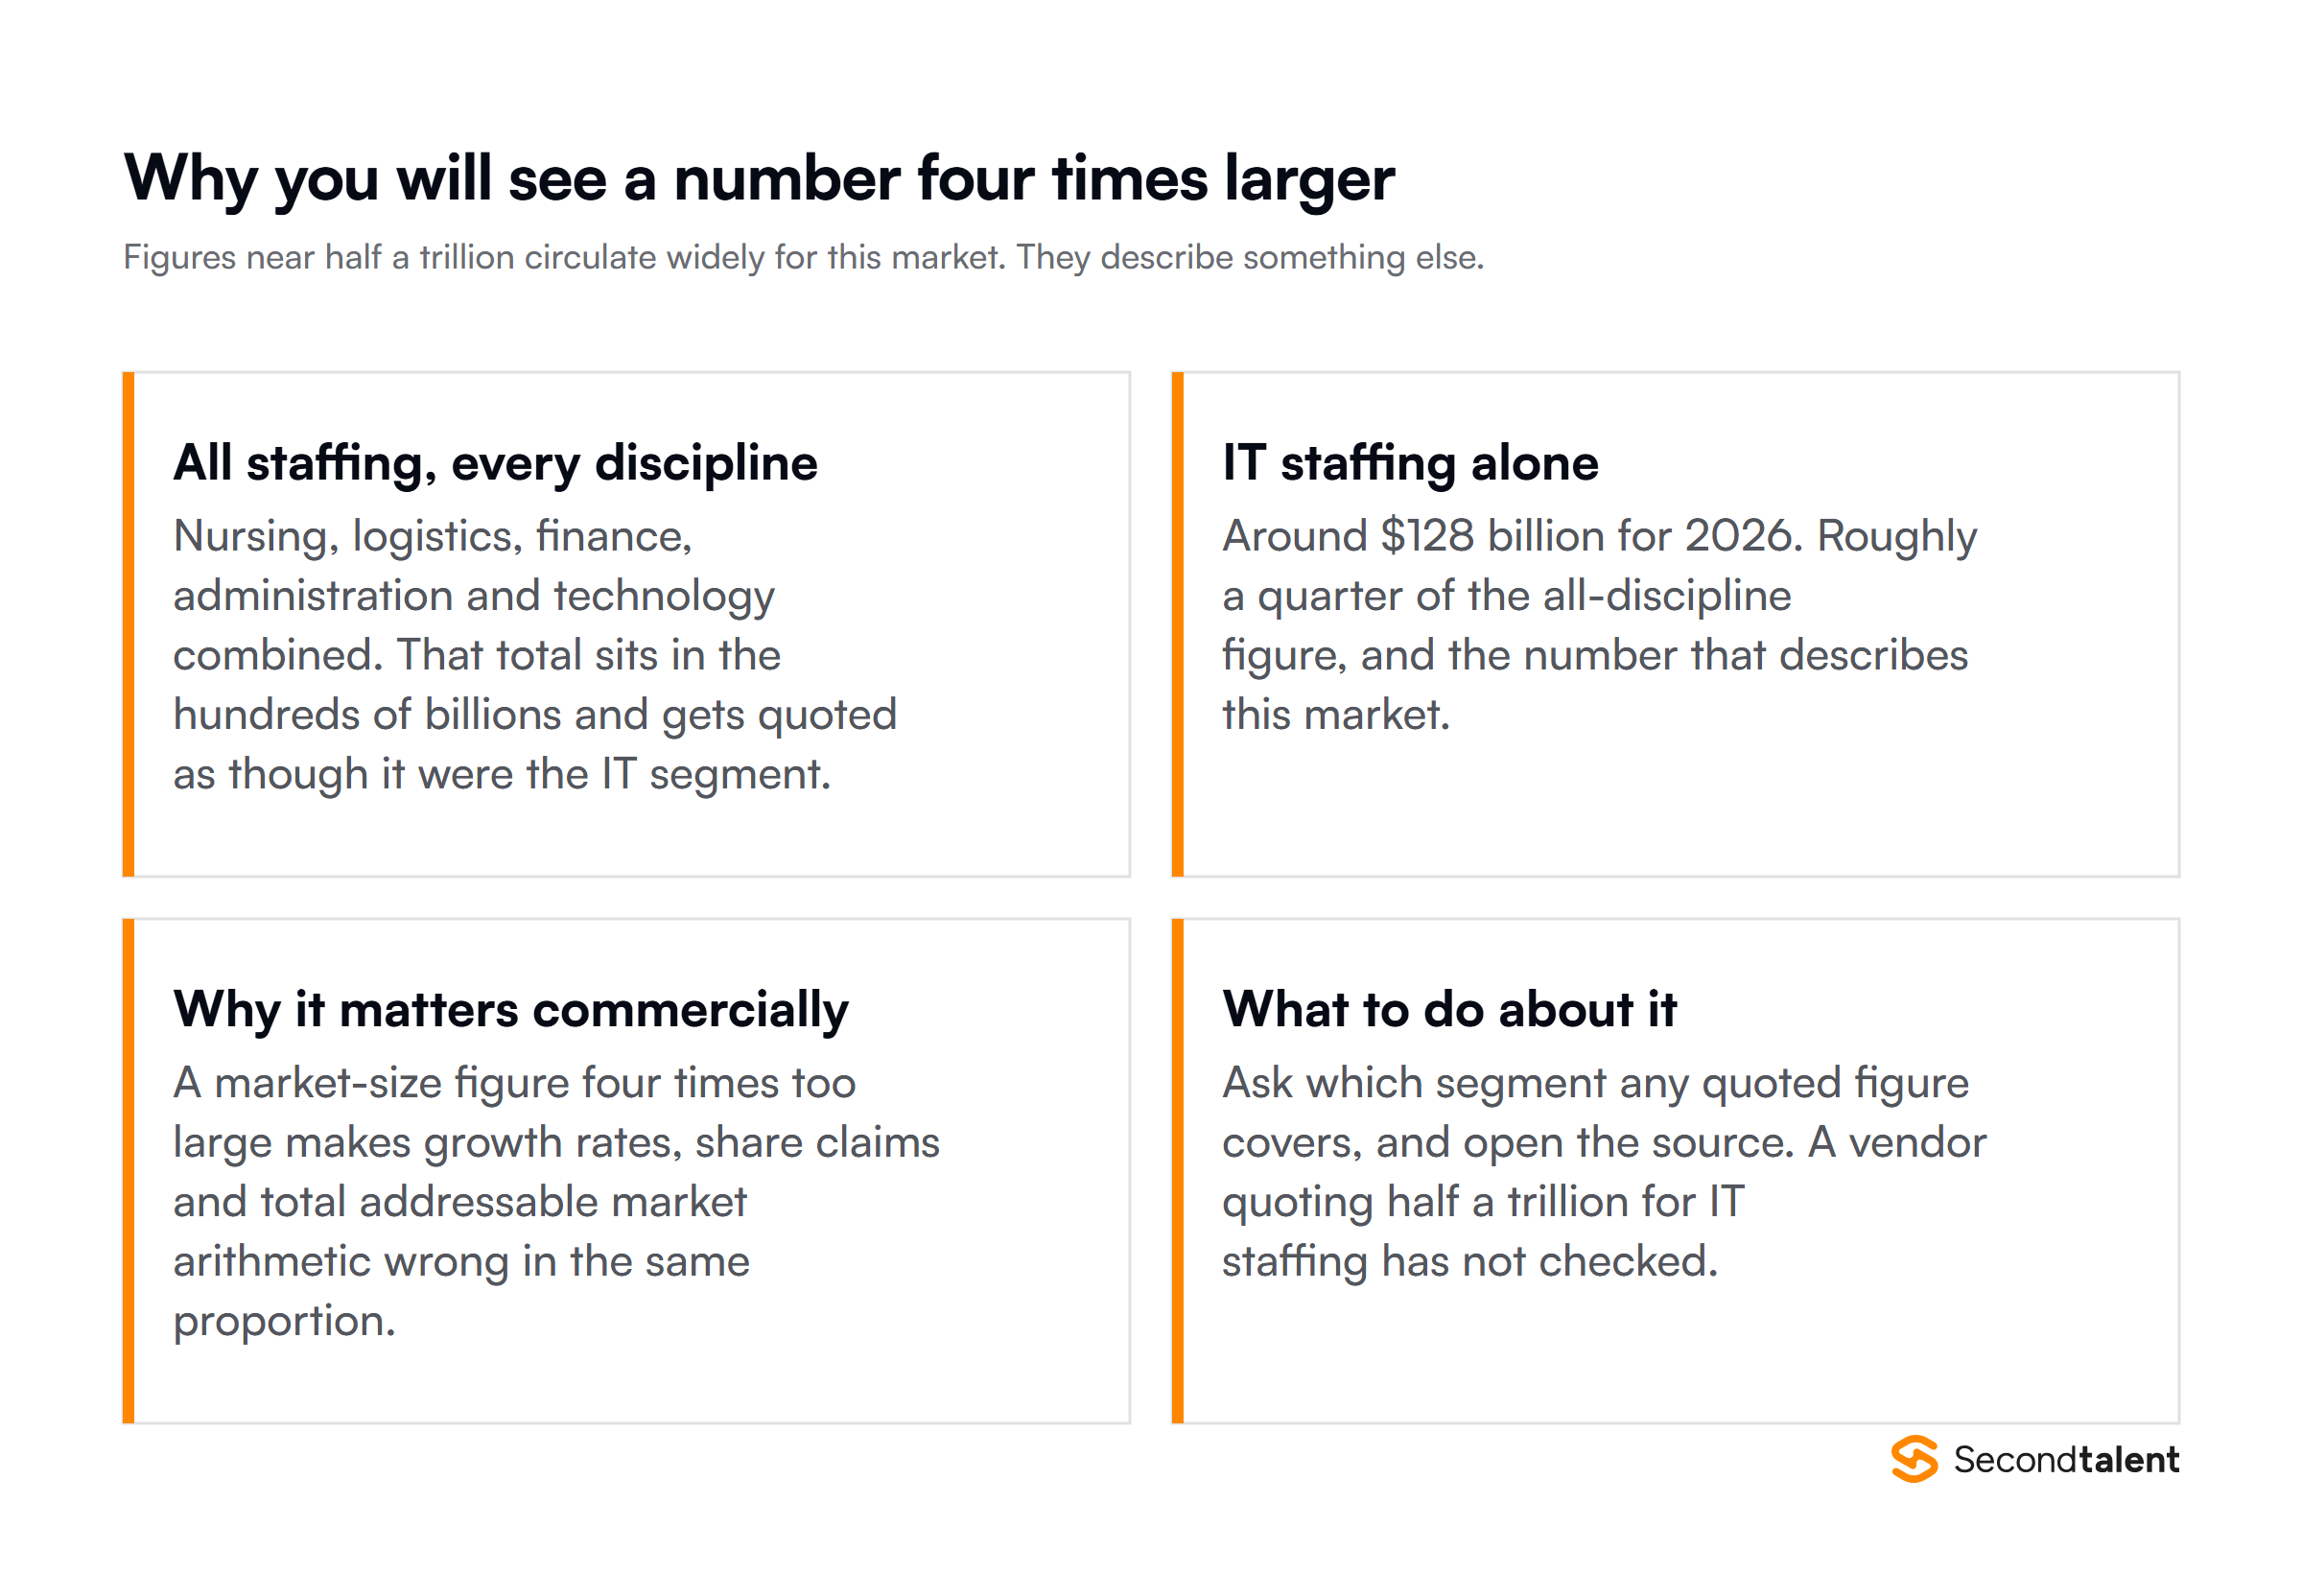
Figures near half a trillion dollars circulate widely for this market and describe something else.
That larger number covers staffing across every discipline: nursing, logistics, finance, administration and technology combined. The IT segment is roughly a quarter of it.
The distinction matters commercially rather than pedantically. A market-size figure four times too large makes every growth rate, share claim and addressable-market calculation built on it wrong in the same proportion. A vendor presenting a half-trillion-dollar IT staffing market has not checked their source, which is worth knowing before you weigh the rest of the pitch.
An earlier version of this page carried that error. It opened with $559 billion attributed to a Gartner forecast. We have corrected it and are flagging it here rather than quietly fixing it, because the same figure is repeated widely enough that readers will meet it again elsewhere and should know why it is wrong.
What sustains demand
A persistent gap between openings and available people, concentrated in specific occupations.
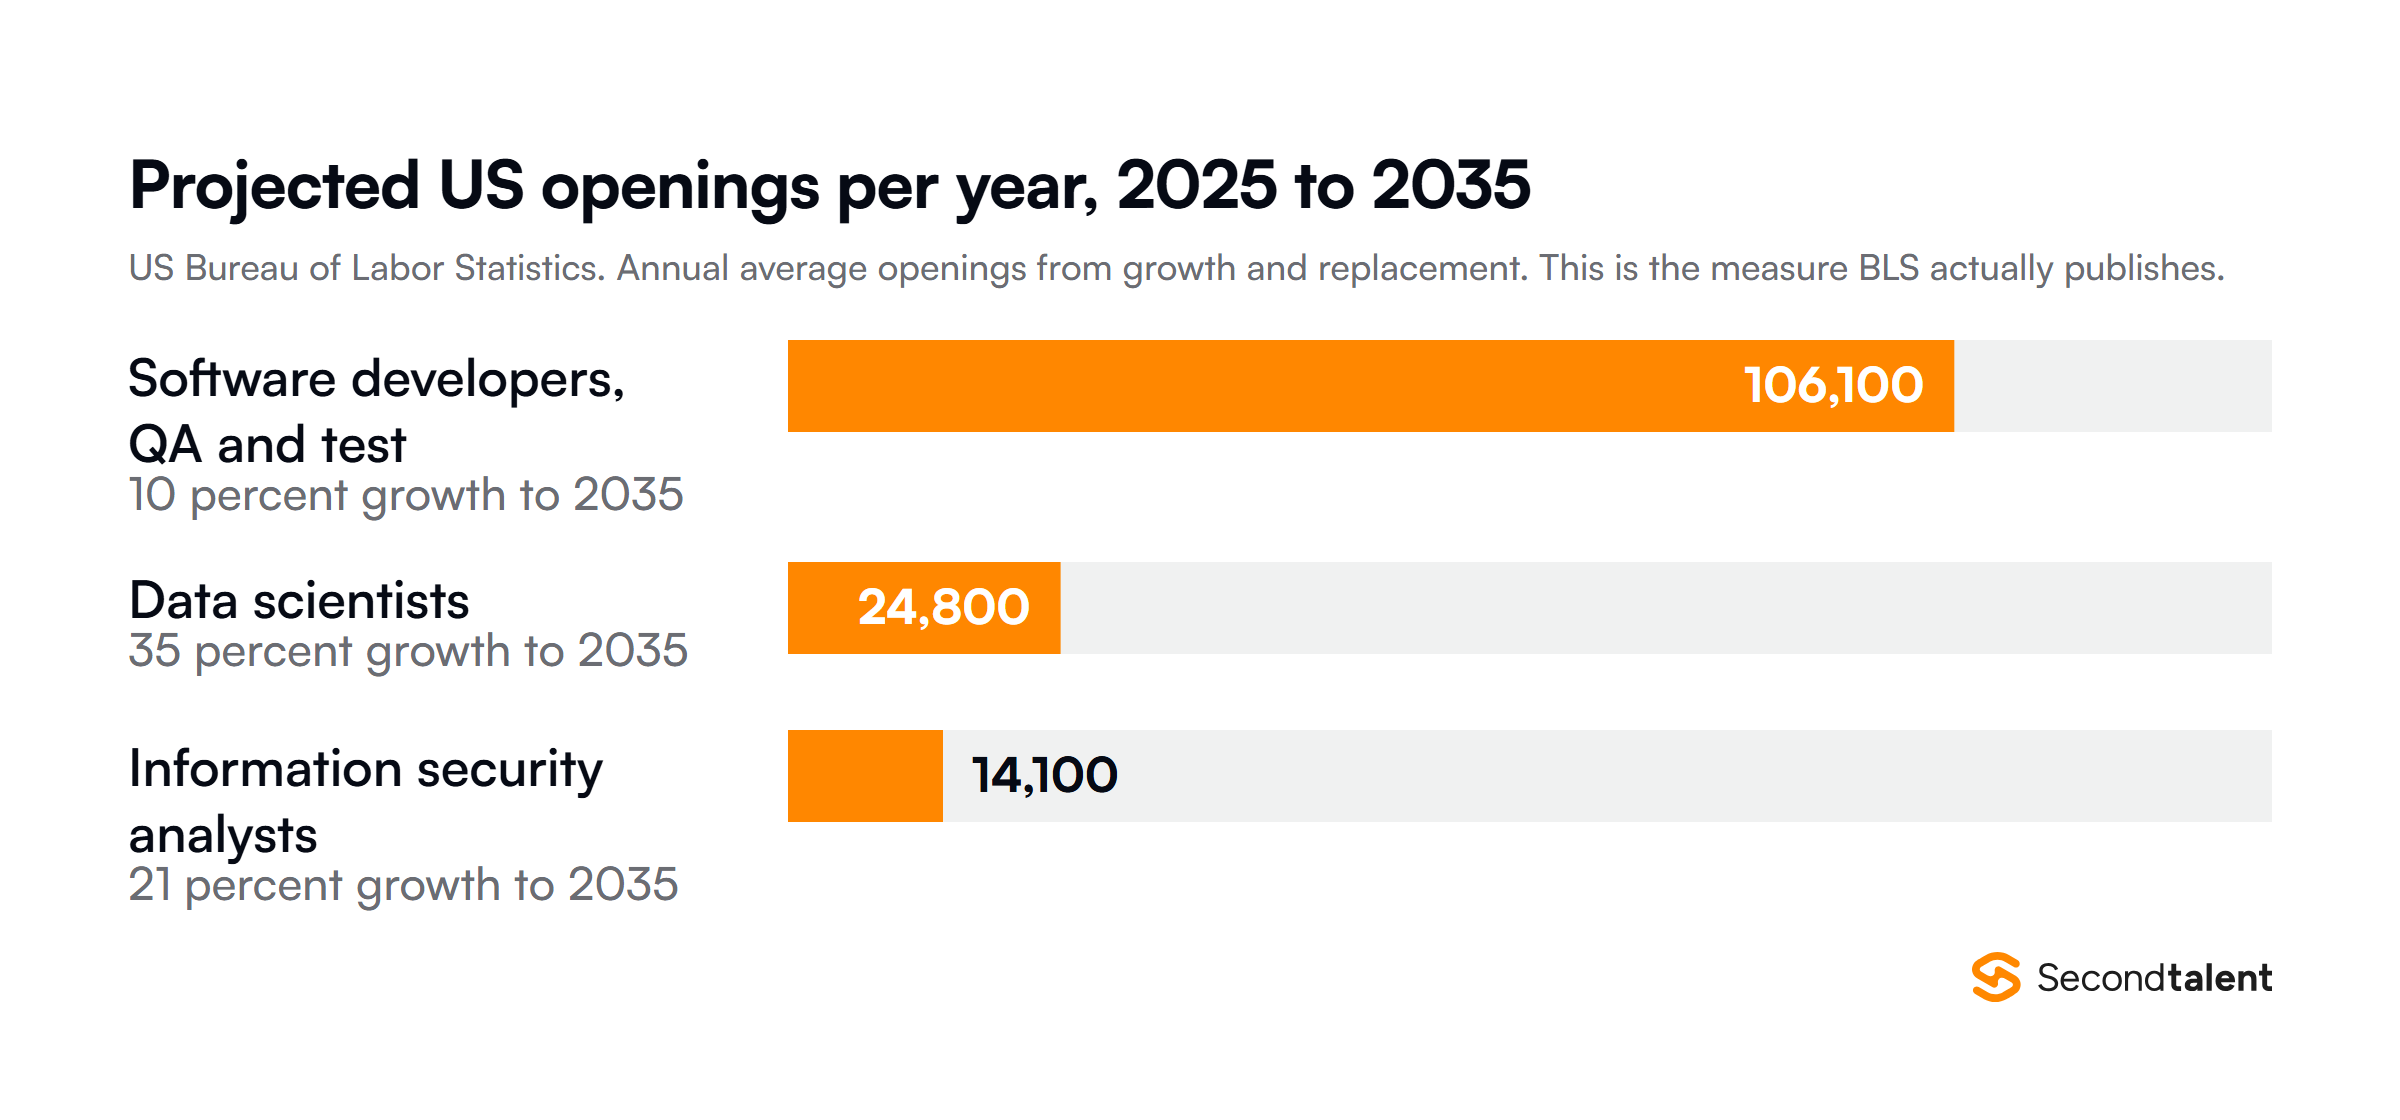
The US Bureau of Labor Statistics projects about 106,100 annual openings for software developers, QA analysts and testers between 2025 and 2035, alongside 10 percent employment growth. Data scientists are projected to grow 35 percent with about 24,800 openings a year, and information security analysts 21 percent with 14,100, against roughly 4 percent growth across all occupations.
Annual openings is the right measure here, and it is worth naming because a related figure gets misquoted often. BLS does not publish a count of unfilled positions. It publishes projected openings from growth and replacement, which is a different thing being cited as though it were a vacancy backlog.
Four shifts worth tracking
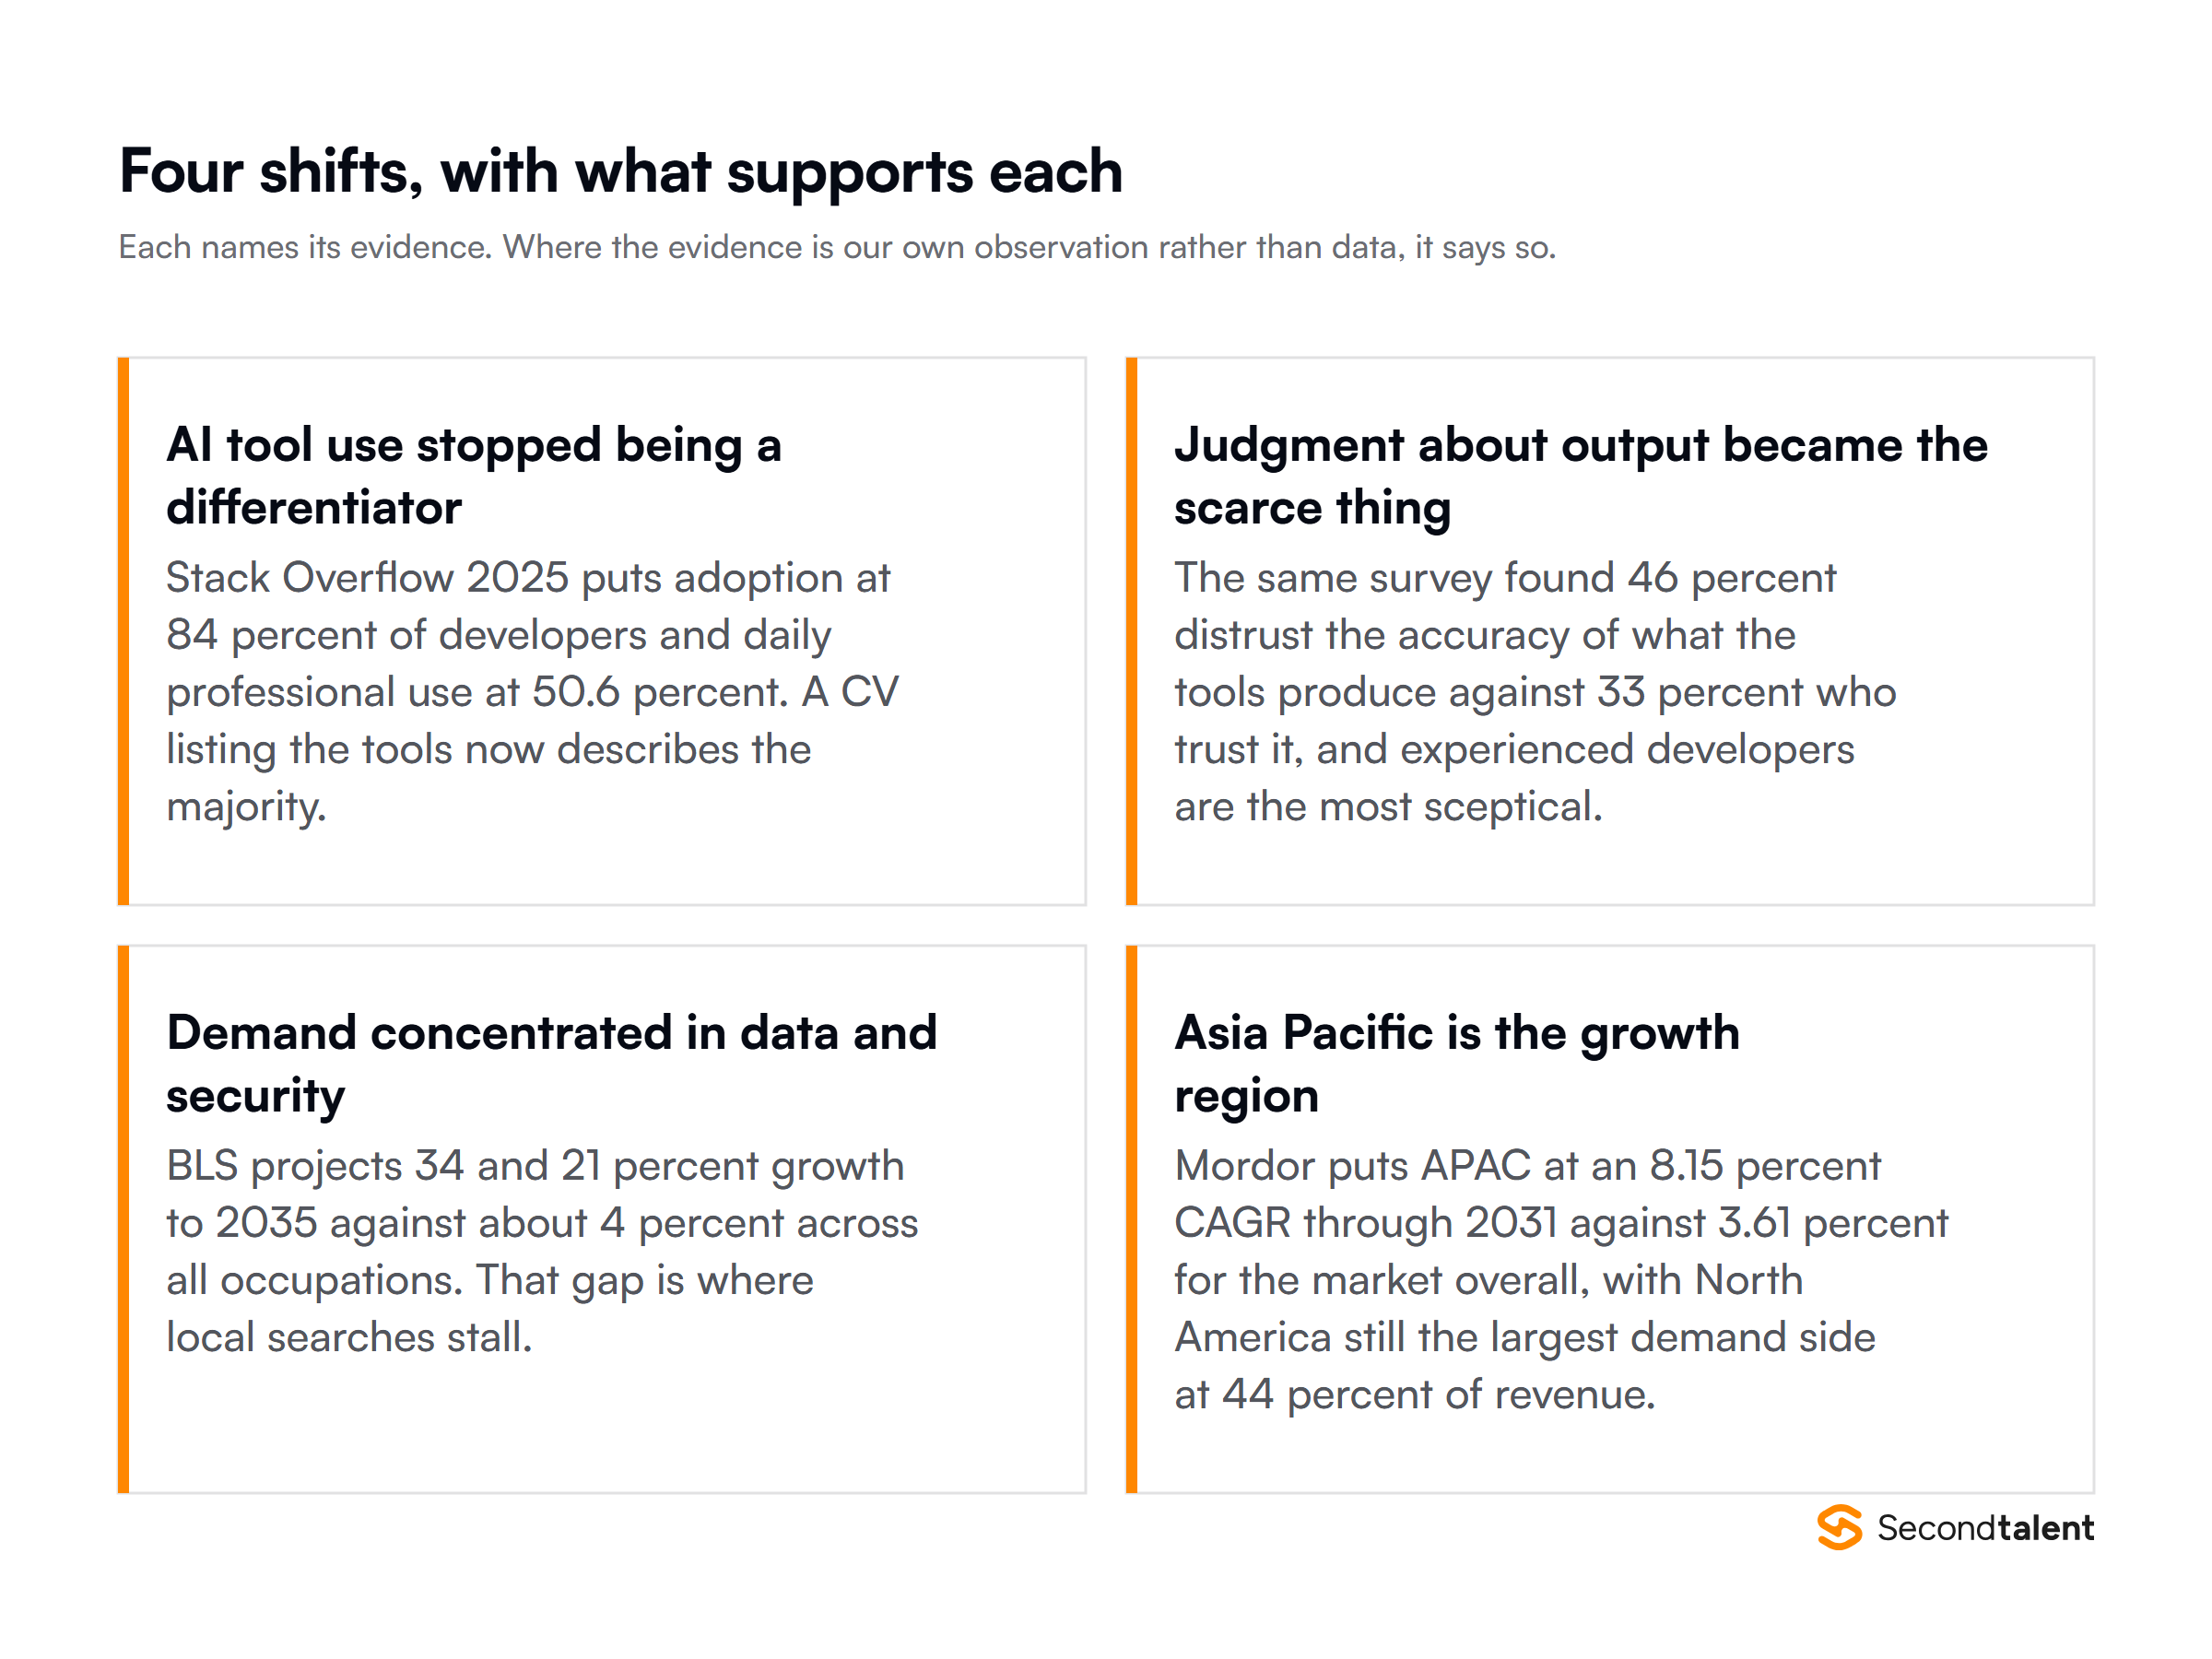
AI tool use stopped differentiating candidates. The 2025 Stack Overflow Developer Survey puts adoption at 84 percent of developers and daily professional use at 50.6 percent. A CV listing the tools now describes the majority.
Judgment about output became the scarce part. The same survey found 46 percent distrust the accuracy of what these tools produce against 33 percent who trust it, with the most experienced developers the most sceptical. That gap is what vetting now has to test for, and our guide to how vetting funnels work covers how.
Demand concentrated in data and security. The BLS growth gap above is where local searches stall and where widening the map buys candidates rather than just a discount.
Asia Pacific is the growth region. At 8.15 percent against 3.61 percent for the market overall, with North America still the largest demand side. Supply and demand are growing in different places, which is the structural fact underneath most sourcing decisions.
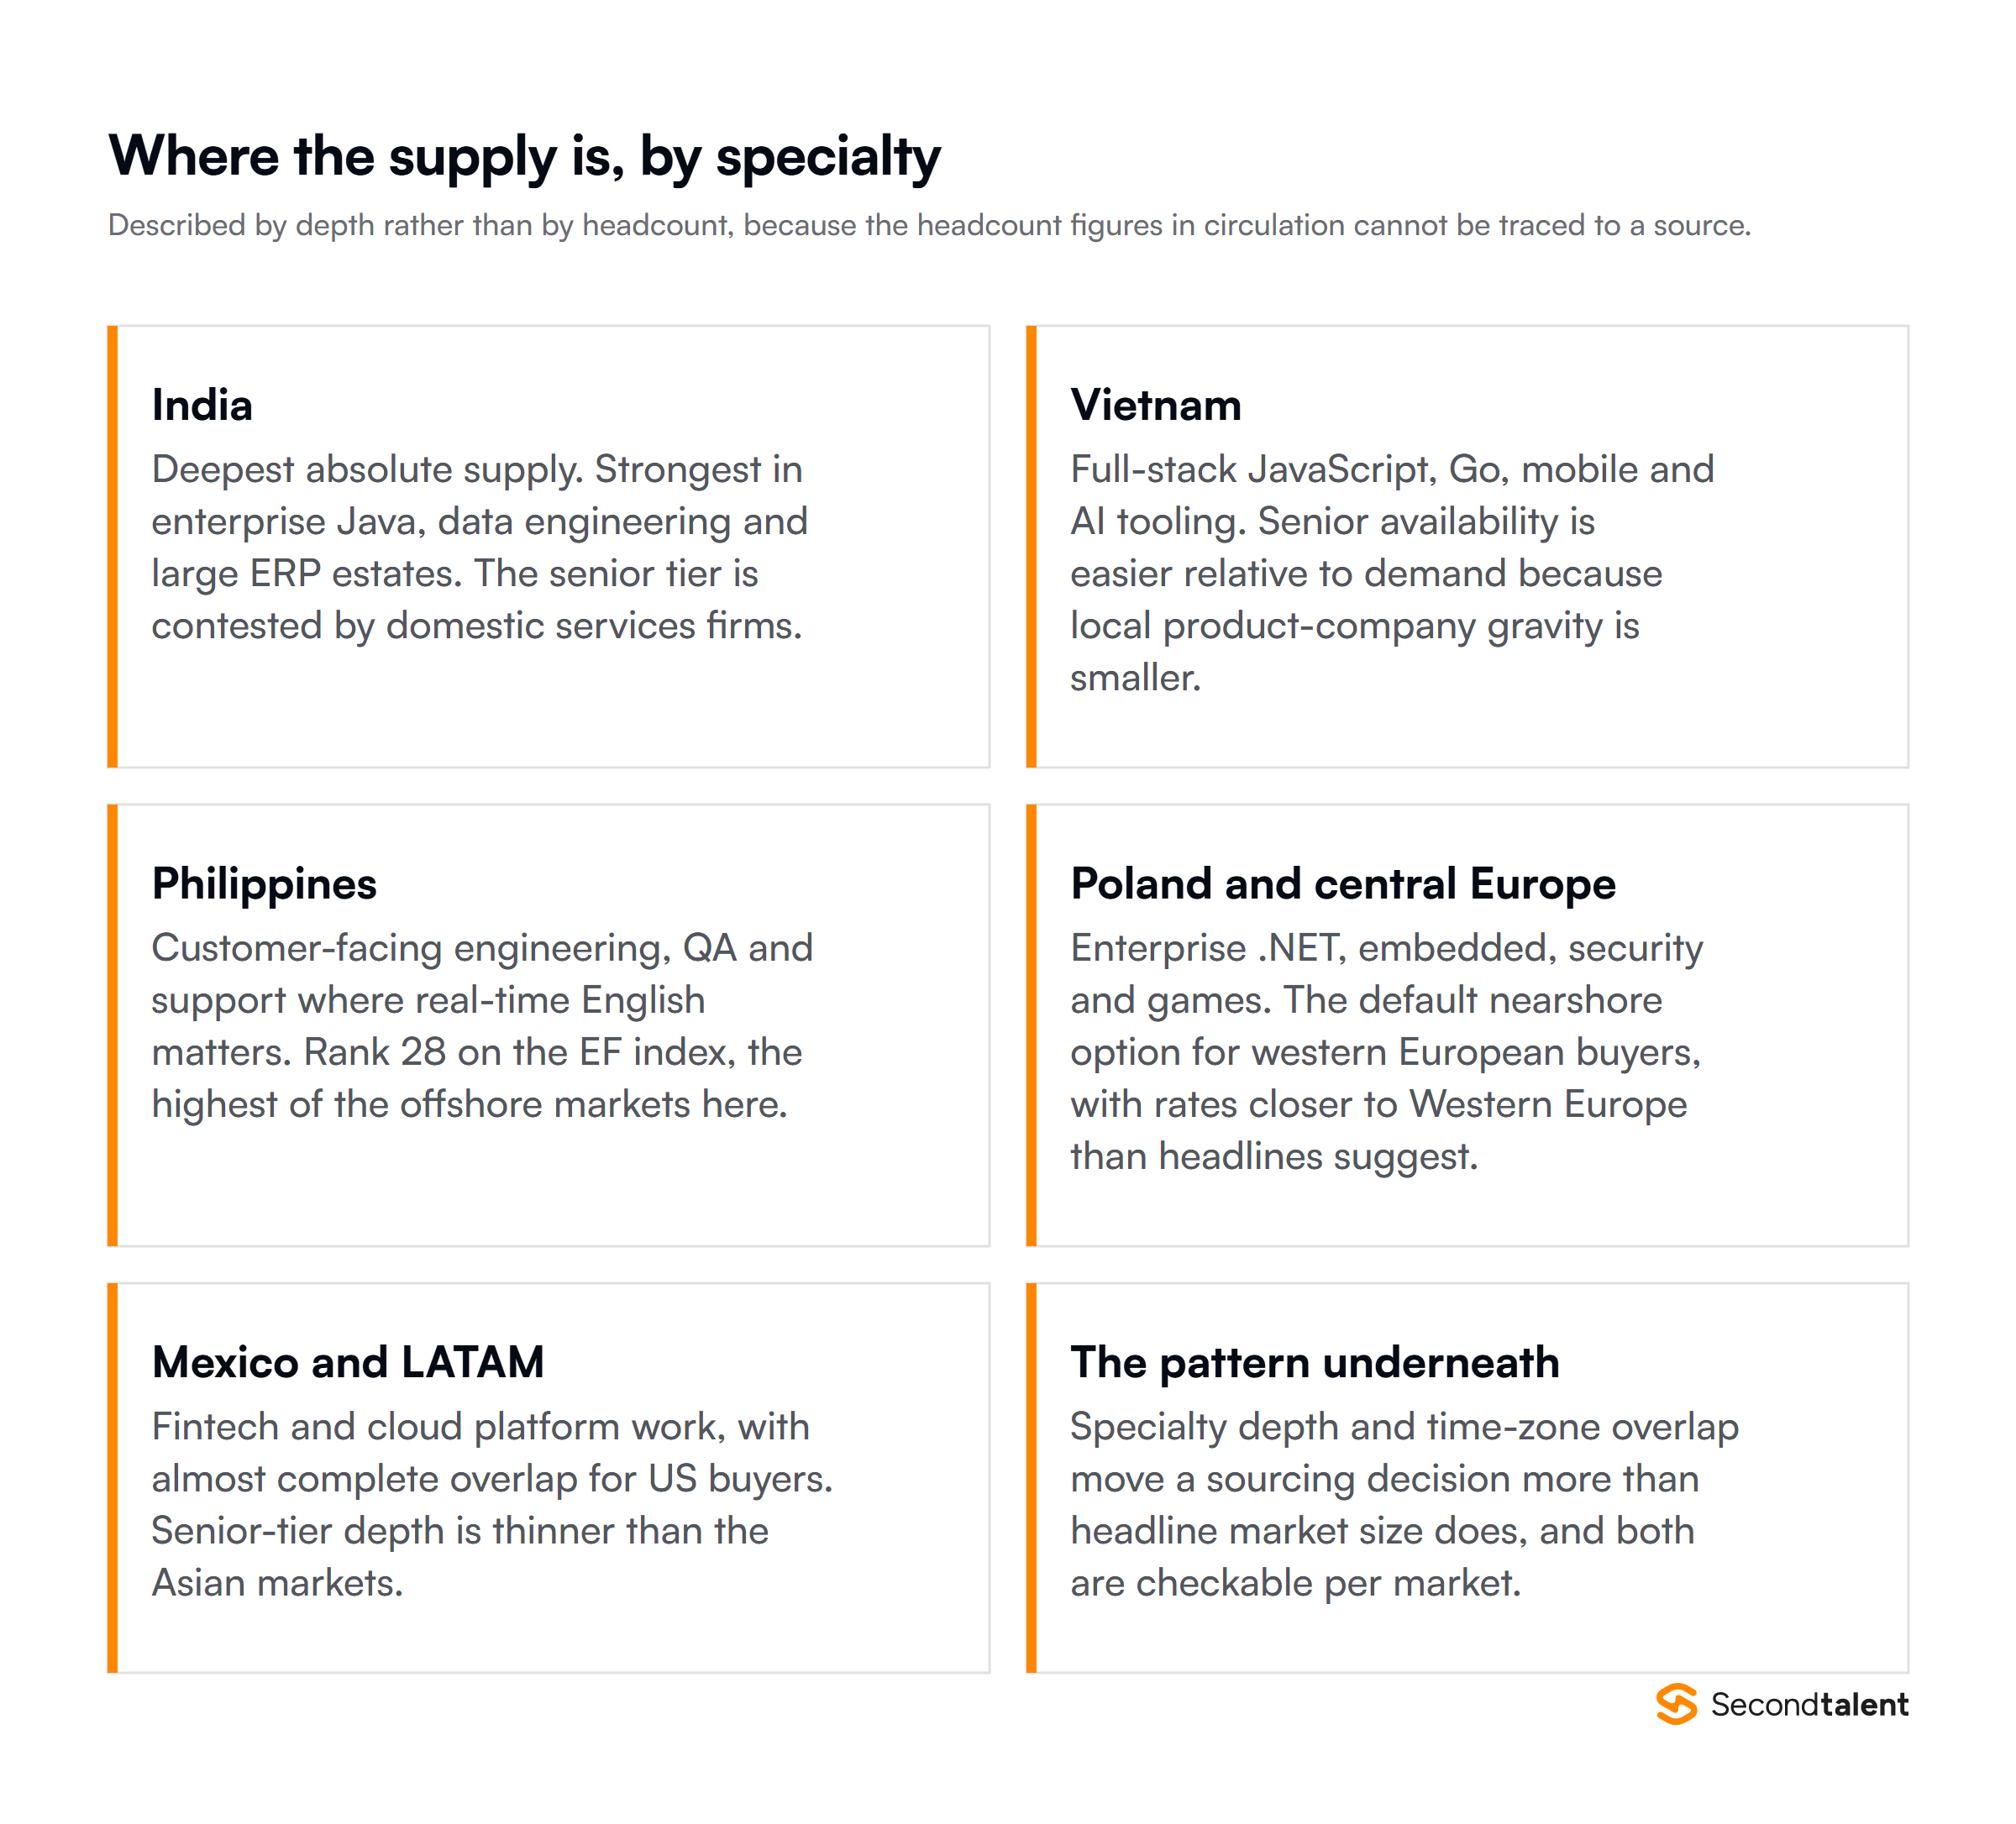
Where the supply is
Described by specialty depth rather than by headcount. Regional workforce totals circulate widely in this category and we could not trace the common ones to a source that publishes them, so we are not repeating them.
India holds the deepest absolute supply, strongest in enterprise Java, data engineering and large ERP estates, with the senior tier contested by domestic services firms.
Vietnam concentrates around full-stack JavaScript, Go, mobile and AI tooling, with senior availability easier relative to demand.
The Philippines is strongest where real-time English matters, and sits at rank 28 on the EF English Proficiency Index with a score of 569, the highest of the offshore markets in this set.
Poland and central Europe run deep in enterprise .NET, embedded, security and games, and are the default nearshore option for western European buyers.
Mexico and Latin America cover fintech and cloud platform work with near-total overlap for US buyers, though senior-tier depth is thinner.
Our comparison of onshore, nearshore and offshore works through choosing between them.
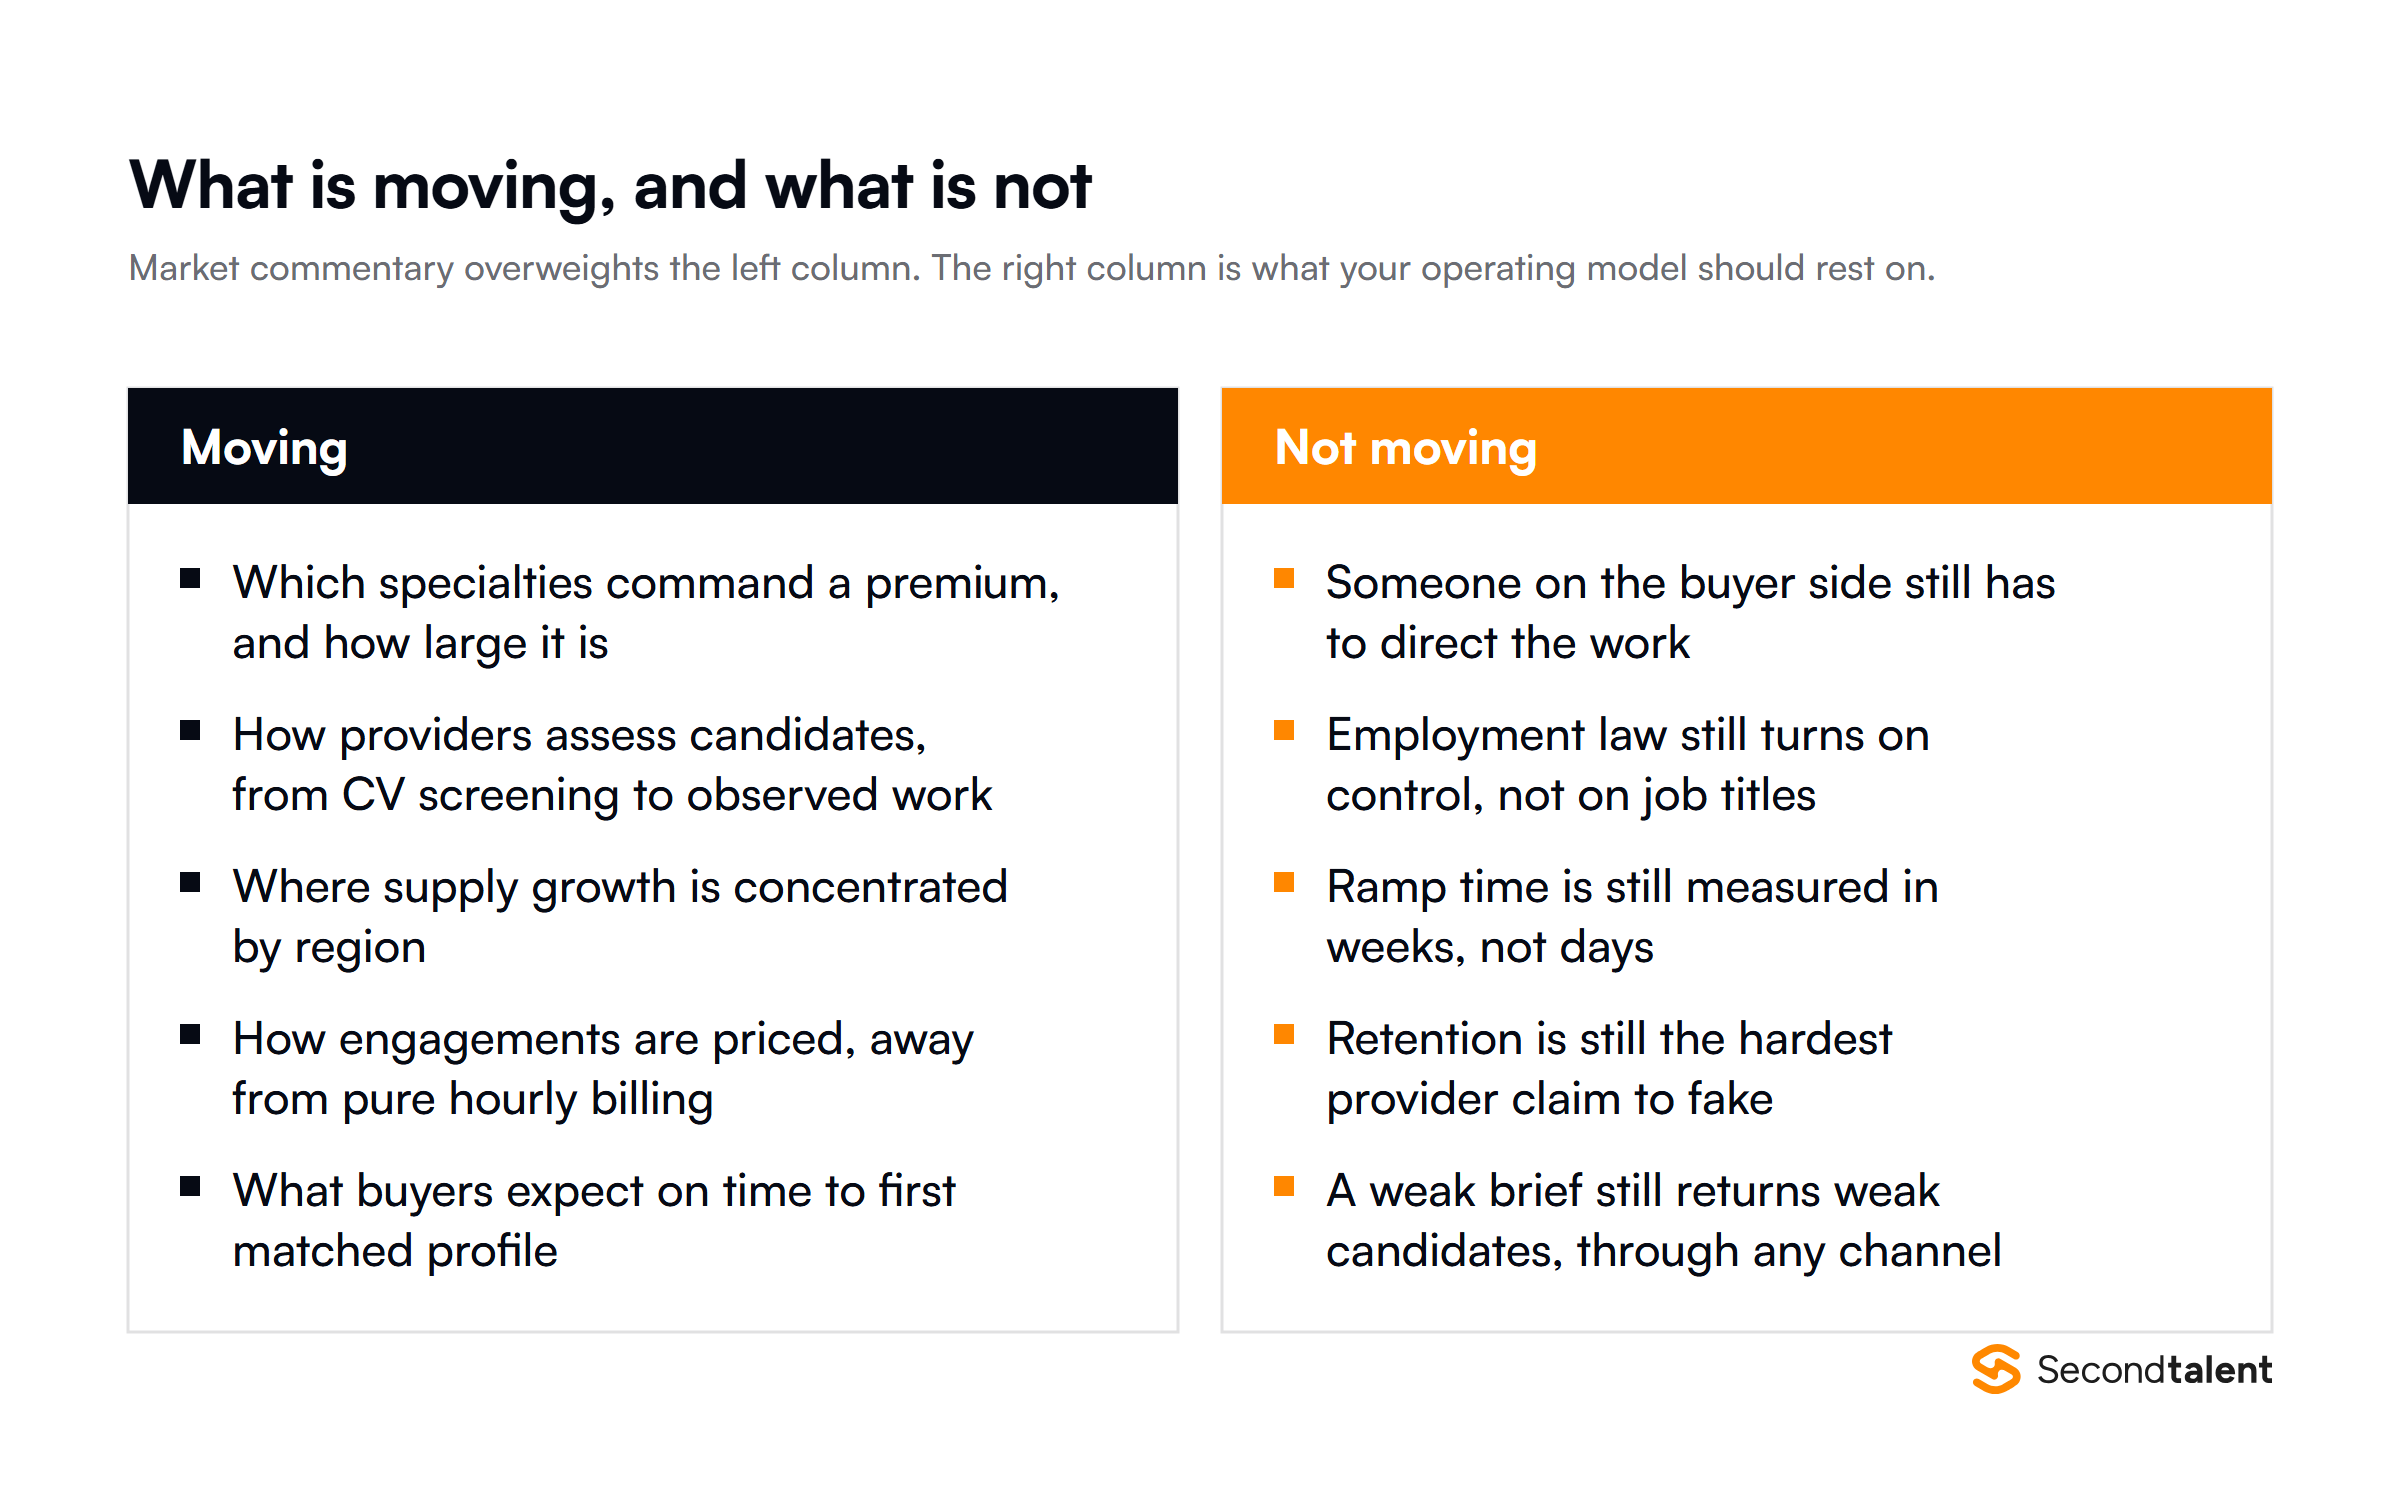
What is moving, and what is not
Market commentary overweights change, which makes it poor input for an operating model.
Moving: which specialties command a premium, how providers assess candidates, where supply growth concentrates, how engagements are priced, and what buyers expect on time to first profile.
Not moving: someone on the buyer side still has to direct the work, employment law still turns on control rather than job titles, ramp is still measured in weeks, retention is still the hardest provider claim to fake, and a weak brief still returns weak candidates through any channel.
Build your process on the right-hand column and stay curious about the left.
How to read market research in this category
This category produces a lot of confident numbers and relatively little checkable data, so a few habits pay for themselves.
Ask which scope a figure covers. All staffing or IT only. Contract only, or contract plus permanent placement. Revenue or client spend. Two figures differing by 4x often measure different things rather than disagreeing.
Open the source before repeating a number. A named research firm attached to a statistic makes it harder to question rather than more likely to be true. If the link goes to a homepage or a topic hub rather than to a page carrying the figure, treat the figure as unsupported.
Prefer statistical agencies for labour data. BLS, Eurostat and their equivalents publish method alongside numbers and update on a schedule. Vendor research is useful for market sizing and weaker for anything about people.
Distrust round numbers about the future. A precise projection for a year three out is a model output, and the assumptions matter more than the figure. Ask what the model assumed about supply.
What we could not establish
Being explicit about the gaps is more useful than filling them. Three claims are deliberately absent from this page.
We do not have provider concentration data, so there is no claim here about what share the largest firms hold. We do not have reliable regional workforce headcounts, which is why supply is described by specialty depth instead. And we do not have survey data on buyer preferences, so nothing here reports what percentage of buyers do anything.
Each of those appeared in the previous version of this page attributed to a research firm. Removing them left the article shorter and more useful, which is usually the sign that a number was decoration rather than evidence.
What this means for a buyer
Three practical consequences follow from the picture above.
Do not budget from a market-size figure. Total market size tells you almost nothing about what a seat costs. Use published rates and a fully loaded local baseline instead, as covered in our pricing guide.
Expect a fragmented supplier landscape. This is not a market with three dominant providers, which means shortlisting genuinely matters and reputation carries less signal than a funnel report does.
Weight the growth regions in sourcing, not in strategy. Asia Pacific growing fastest tells you where supply is expanding. It does not tell you which market fits your specialty or your overlap requirement, which are the questions that decide a placement.
Where this market goes next
Two things can be said with reasonable confidence and one cannot, which is a useful way to end a market piece.
Reasonably confident: the demand concentration in data and security persists, because BLS projections run to 2034 and supply cannot adjust that fast. And Asia Pacific keeps growing faster than the market overall, because the gap between where demand sits and where supply is expanding is structural rather than cyclical.
Cannot be claimed: what any of this looks like in dollar terms in three years. Forecasts that precise are model outputs, and the assumptions inside them about AI tooling and productivity are exactly the assumptions nobody has good data for yet.
If you are building a plan against this market, build it against the demand concentration and the supply geography, which are observable, rather than against a total market figure for 2029.
Market FAQs
Is the IT staffing market growing or shrinking?
Growing, at a modest aggregate rate, with the growth uneven across regions and specialties. A single market growth figure hides more than it explains here.
Will AI reduce the size of this market?
Nothing measurable points that way yet, and BLS still projects growth well above the all-occupation average in the relevant roles. What is visible is a change in the mix rather than in the total, and anyone forecasting the total with confidence is guessing.
Why do market size figures vary so much?
Because different sources measure different scopes: all staffing versus IT only, contract only versus contract plus permanent placement, revenue versus spend. Ask which scope a figure covers before comparing two.
How often should a buyer revisit the market view?
Annually is plenty for the macro picture, since a market growing at 3.61 percent does not change shape in a quarter. What is worth checking more often is your own supplier landscape: rates reset at renewal, benches change as providers grow or lose people, and the retention figure that persuaded you is a year old by the time you renew.
Does market fragmentation help or hurt buyers?
Helps, mostly. More providers means more competition on terms and more specialists per market. It also means diligence matters more, since brand recognition substitutes poorly for a funnel report and a retention figure.
Takeaways
- IT staffing is around $128 billion in 2026, not the half-trillion figure widely quoted.
- That larger number covers staffing across every discipline, and the error propagates.
- BLS publishes projected annual openings, not a count of unfilled positions.
- Supply grows fastest in Asia while demand stays largest in North America.
- Build your process on what is not changing, and stay curious about what is.
Move from market view to a seat
Second Talent places pre-vetted senior engineers across Asia with EOR cover, matched within 24 hours at 92 percent twelve-month retention across more than 200 companies.
Tell us which seat you need to fill, or open the developer rate cards for rates by role and market.