Cost to hire a developer
Hourly rates for 61 stacks and roles across 9 regions, benchmarked against United States. Pick a stack and a seniority level to see the full regional spread and how each market compares with the United States.
Updated quarterly · Last updated 12 September 2026
United States
$85-$135/hr
$13,600-$21,600 a month
—
—
Difference
—
per month at 160 hours
| Region | Hourly | Per month | vs United States | Spread |
|---|---|---|---|---|
| United States The benchmark benchmark measured | $85-$135 | $13,600-$21,600 | benchmark | |
| Western Europe UK, DE, FR measured | $45-$72 | $7,200-$11,520 | −47% | |
| Latin America BR, AR, MX, CO vendor data | $44-$70 | $7,040-$11,200 | −48% | |
| Southeast Asia VN, PH, ID, MY, TH vendor data | $37-$59 | $5,920-$9,440 | −56% | |
| Australia & NZ Sydney, Melbourne, AKL vendor data | $82-$131 | $13,120-$20,960 | −3% | |
| Northern Europe Nordics, Baltics vendor data | $73-$116 | $11,680-$18,560 | −14% | |
| Eastern Europe PL, RO, UA vendor data | $50-$80 | $8,000-$12,800 | −41% | |
| Africa NG, KE, EG, ZA vendor data | $34-$54 | $5,440-$8,640 | −60% | |
| South Asia IN, PK, BD measured | $19-$30 | $3,040-$4,800 | −78% |
The reference band. Full-stack sits at the midpoint of freelance application work.
Rates by stack
Each stack is priced in one of seven bands. The band is stated on every page, because no published dataset resolves freelance rates to the individual language.
Rates by market
Every role priced in one country, with its own sourced compensation ratio rather than its region's. 15 markets are published so far.
Offshore software development rates by country
Mid-level freelance rates in US dollars, for the application & backend band. Change the role or the seniority in the calculator above and these move with it.
| # | Country | Hourly (USD) | Monthly at 160 hrs | vs United States | Basis |
|---|---|---|---|---|---|
| 1 | United States | $85-$135 | $13,600-$21,600 | benchmark | country median |
| 2 | Canada | $85-$135 | $13,600-$21,600 | benchmark | regional |
| 3 | United Kingdom | $53-$84 | $8,480-$13,440 | −38% | country median |
| 4 | Germany | $47-$74 | $7,520-$11,840 | −45% | country median |
| 5 | Sweden | $73-$116 | $11,680-$18,560 | −14% | regional |
| 6 | Denmark | $73-$116 | $11,680-$18,560 | −14% | regional |
| 7 | Brazil | $44-$70 | $7,040-$11,200 | −48% | regional |
| 8 | Mexico | $44-$70 | $7,040-$11,200 | −48% | regional |
| 9 | Vietnam | $28-$68 | $4,480-$10,880 | −67% | regional |
| 10 | Philippines | $22-$58 | $3,520-$9,280 | −74% | regional |
| 11 | Poland | $50-$80 | $8,000-$12,800 | −41% | regional |
| 12 | India | $20-$52 | $3,200-$8,320 | −76% | regional |
Offshore is a direction, not a rate. Which country you pick moves the number 4.3x, against 1.9x for the choice between the cheapest and the dearest role on this whole page. Geography is the larger lever by some distance: India runs about 76% under the United States benchmark of $85 to $135 an hour, while Canada prices at parity with it. A quote described only as "offshore" tells you almost nothing until the country is named.
The hourly rate is not the cost. Three things it leaves out reliably move the total by more than the rate difference between two neighbouring markets: how many working hours actually overlap with your team, who does the managing when the engineer is not in your standup, and what a replacement costs if the engagement ends early. The saving is real, and it is smaller than the table alone implies.
Three of these ten have a country median published by name and three carry the rates we quote and place at in that market. The rest inherit their region's ratio and are marked regional in the basis column, because a country figure we cannot source is not a country figure. The regional ones come from a commercial rate guide, and where that guide can be checked against measured compensation data it runs 64% to 70% high.
Where these numbers come from
How a cell is built
Start from a published employee median for the role in the US. Divide by 2,080 hours. Multiply by 1.431, because the BLS puts wages at 69.9% of what an employer actually spends per employee, and a contractor carries the other 30.1% themselves. Then divide by a billable utilisation of 70% to 85%. That gives the United States band at the middle of the wage distribution. Region and seniority then scale it.
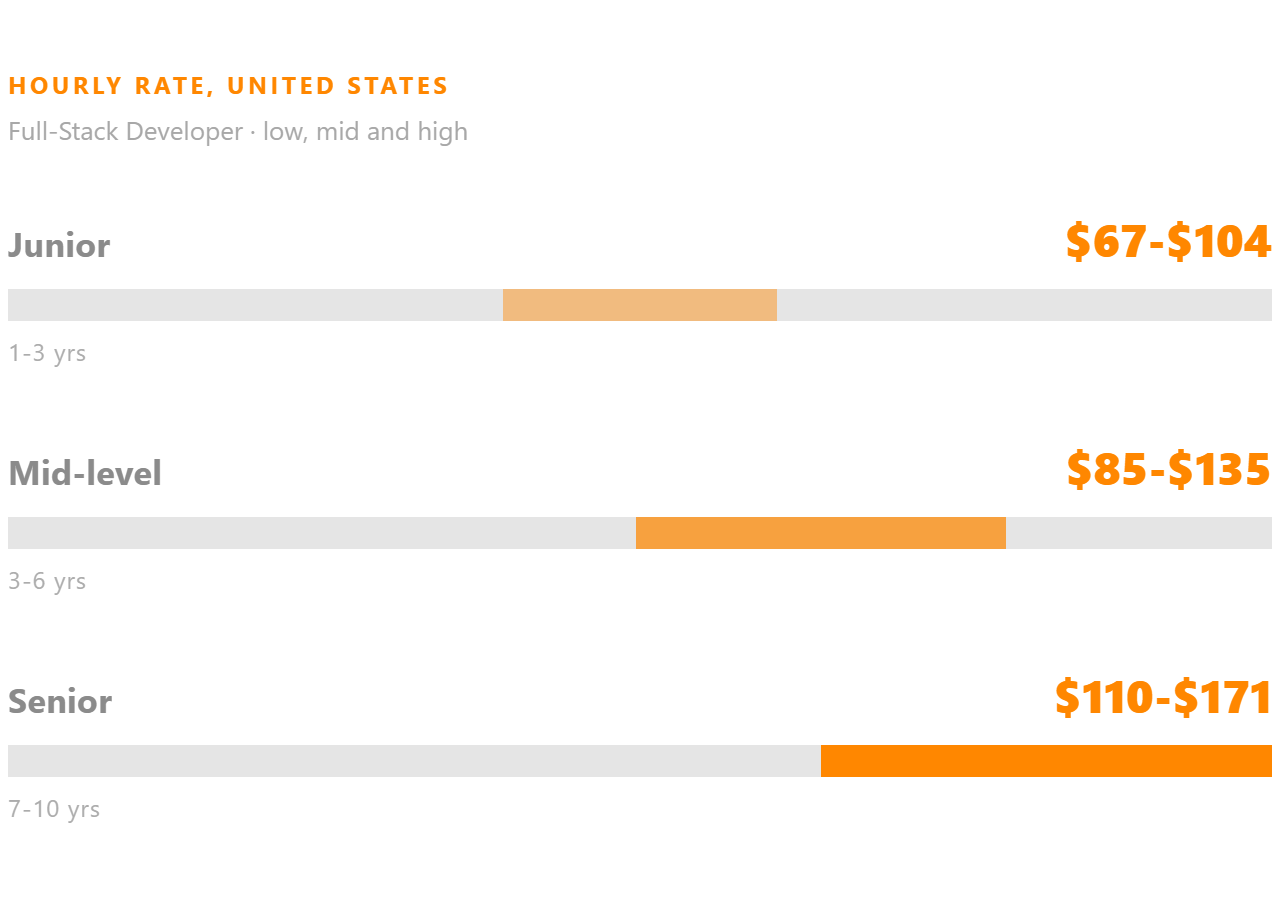
Worked example, full-stack: $138,000 ÷ 2,080 = $66.35/hr as an employee. × 1.431 = $95.00 in employer cost. ÷ 0.85 and ÷ 0.70 gives $110 to $135. The independent check: the BLS's own establishment survey puts the software developer median at $65.38/hr, 1.5% from the $66.35 above.
Seniority is measured, not assumed. The BLS publishes the whole wage distribution for software developers, from $39.64/hr at the 10th percentile to $103.21 at the 90th. Each level here spans two published percentiles, which is why junior to staff is a 2.5x spread rather than a number we picked.
What this model will not do
It will not price Java against Python to the dollar; no credible public dataset resolves freelance rates by language. It will not treat a commercial rate guide as equivalent to a statistical agency, which is why six of the nine regions here are labelled vendor-sourced. And it will not hide that utilisation is estimated: no agency publishes it, so it is given as a band and every number inherits that uncertainty.
Sources
- Government US Bureau of Labor Statistics: Occupational Employment and Wage Statistics The United States anchor, and the check on Stack Overflow
- Government US Bureau of Labor Statistics: OEWS, Web and Digital Interface Designers The design band, which no developer survey covers
- Government US Bureau of Labor Statistics: Employer Costs for Employee Compensation The 1.431 load factor a contractor carries themselves
- Research Stack Overflow Developer Survey 2025 Employee medians by role, and the Western Europe and South Asia ratios
- Government O*NET OnLine (US Department of Labor) Verification route for the OEWS figure above
- Commercial Arc: Freelance Developer Rates 2026 The six region ratios with no government or research equivalent. Marked as vendor-sourced on the page, because where it overlaps with measured data it runs 64% to 70% high. On a re-check the page could not be fetched directly, so its date and sample rest on search snippets rather than a read of the page
- Commercial FullStack Labs: Software Development Pricing Report The agency markup only. Marked as commercial, and never averaged with the derived figures
- Commercial Accelerance: 2026 Global Software Outsourcing Rates Cross-check only. Never averaged into a published figure
Published figures, shown unblended
- United States Employee median $65.38/hr. Stack Overflow's US full-stack median works out at $66.35/hr, so a full establishment survey and a self-selected one land 1.5% apart
- Western Europe Full-stack medians against the US figure: UK 0.62x, Germany 0.55x, France 0.42x. Read on one role rather than mixed, because the same countries read 0.59x and 0.46x on engineering-manager pay. The commercial guide puts the whole region at 0.90x
- South Asia India runs 0.10x the US figure on full-stack pay and 0.26x on engineering-manager pay. The region is published here at 0.22x, above that developer range, because the survey's India sample skews junior. The commercial guide puts the region at 0.36x
- Design Web and digital interface designers at a $50.00/hr employee median against $65.38 for software developers, so design carries through this model at 0.76x the developer band rather than at parity
- Europe and Asia Junior $31-39 and senior $64-76 in Europe; junior $24-31 and senior $31-41 in Asia, on a 60-partner sample
Citing this page
These are derived figures, not collected ones. We did not survey anybody; we took published government and research data and applied a stated conversion to it. If you quote a number, quote the derivation with it, because the rate is only as good as the employee median and the utilisation assumption underneath it.
Second Talent Freelance Rate Index, Sep, 2026. Derived from US Bureau of Labor Statistics OEWS 2025 and Employer Costs for Employee Compensation (March 2026), with role and country medians from the Stack Overflow Developer Survey 2025 (n=23,928 on compensation). https://www.secondtalent.com/cost-to-hire/
Coverage: 61 roles across 9 regions and 4 seniority levels, 2196 modelled rate cells in total. Reviewed monthly; the source surveys update annually.
Known limits
Utilisation is the weak point. No statistical agency publishes how much of a freelancer's time is billable, so the 70% to 85% band is our estimate and every rate on this page inherits it. Move that assumption and every number moves with it.
Six of the nine regions are vendor-sourced and marked as such in the table. Where a commercial guide can be checked against measured compensation data it runs 64% to 70% high, so treat those six as indicative rather than as evidence.
Regions are broad and languages are not resolved. Warsaw and Kyiv both sit inside "Eastern Europe" and are not the same number. No credible public dataset prices freelance work by programming language, so this one does not pretend to.
Hiring rather than researching?
We place pre-vetted engineers across nine Asian markets on a flat monthly rate. If you want the employment-cost side of this question instead, the salary rate cards price permanent hires by country and role.
Hire developers Salary rate cards