TL;DR: Track DORA's five delivery metrics (deployment frequency, lead time, change failure rate, failed deployment recovery time and rework rate), then cycle time, review pickup time, PR size, a developer experience score and the measured payoff of AI tools. In LinearB's 2026 benchmarks, elite teams keep cycle time under 25 hours and pull requests under 100 code changes.
The 2025 DORA report does not contain the word "elite." After a decade of sorting teams into elite, high, medium and low performers, Google's DORA program replaced the tiers with seven team profiles and added a fifth metric, rework rate.
It also found that AI, used at work by 90% of its nearly 5,000 respondents, now speeds up delivery while still making it less stable.
The 10 Metrics Compared
#
Metric
What it tells you
Strong result
Benchmark source
1
Deployment frequency
How often code reaches users
On demand, several times a day
DORA 2025
2
Lead time for changes
Commit to production
Under one day
DORA 2025
3
Change failure rate
Deploys that break production
Under 1%
LinearB 2026
4
Failed deployment recovery time
Time to fix a bad deploy
Under one hour
DORA 2025
5
Rework rate
Unplanned deploys caused by incidents
0% to 2%
DORA 2025
6
Cycle time
First commit to release
Under 25 hours
LinearB 2026
7
Review pickup and review time
How long PRs wait for people
Pickup under 1 hour, review under 3
LinearB 2026
8
PR size
Code changes per pull request
Under 100
LinearB 2026
9
Developer Experience Index
Friction developers report
Rising score, quarter on quarter
DX
10
Net AI time savings
Hours AI saves, minus what it costs
Positive after review and rework
DX, METR
What changed in 2026
1AI-assisted pull requests are 2.6 times larger than unassisted ones, and PRs opened by agents wait 5.3 times longer for a reviewer.
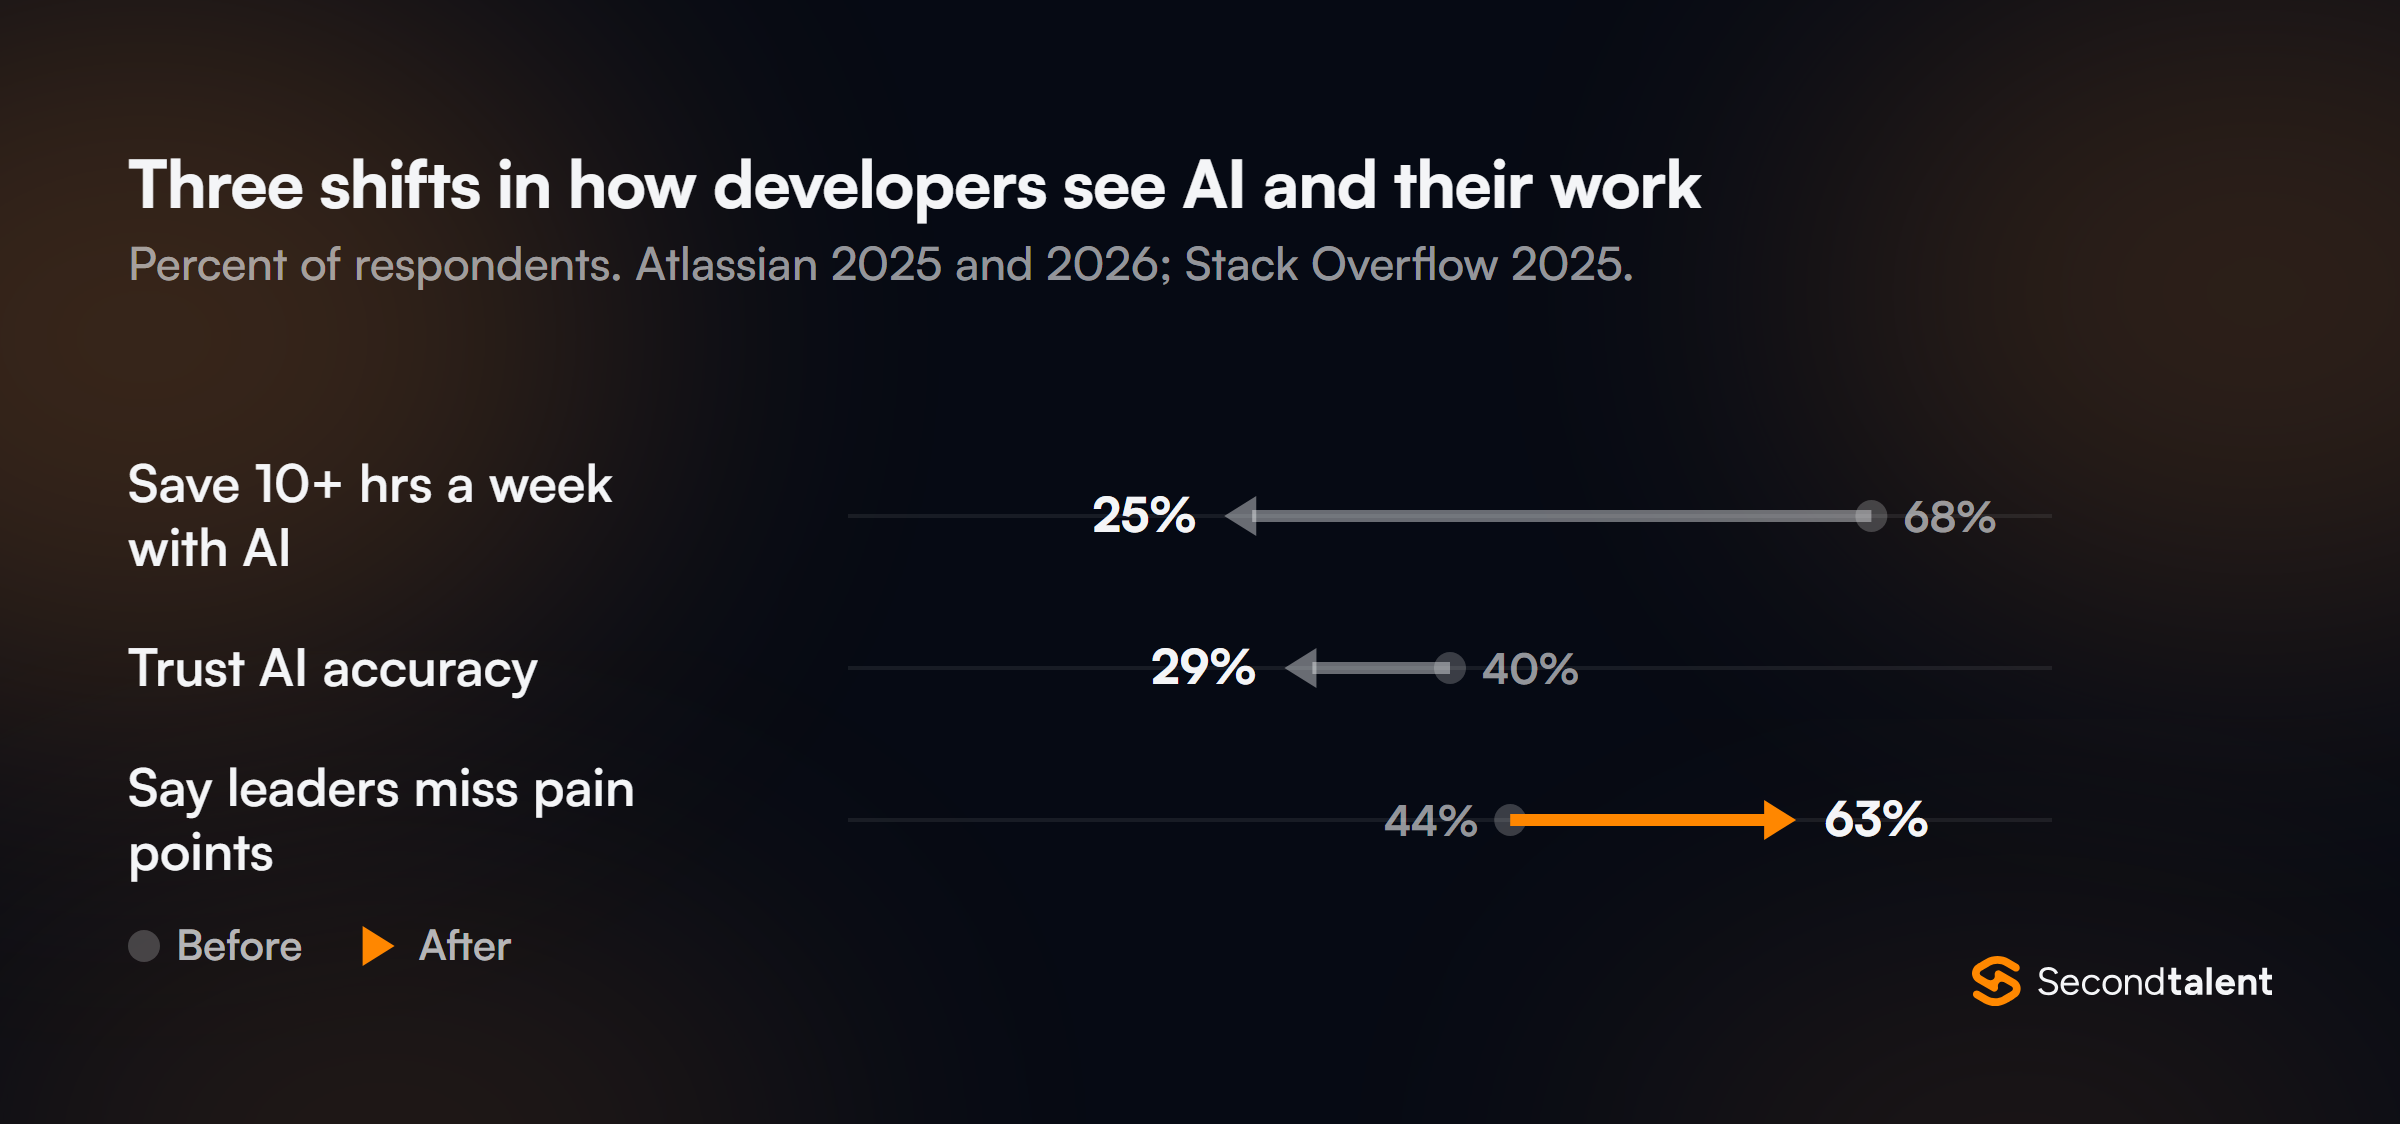
2The share of developers saving 10 or more hours a week with AI fell from 68% to 25% between Atlassian's 2025 and 2026 surveys.
344.7% of organizations do not measure AI's impact on engineering in any formal way.
The 10 Engineering Productivity Metrics
How the list runs. The order follows a change through the pipeline: DORA's five delivery metrics first, then the pull request flow that feeds them, then the two measures of the people doing the work. Benchmarks come from DORA's 2025 survey of nearly 5,000 professionals and LinearB's analysis of 8.1 million pull requests from 4,813 teams.
1. Deployment Frequency
16.2% deploy on demand31.5% deploy weekly to monthlyDORA throughput metric
Deployment frequency counts how often a team ships code to production, and it is the easiest of the five DORA metrics to read straight from a CI/CD pipeline.
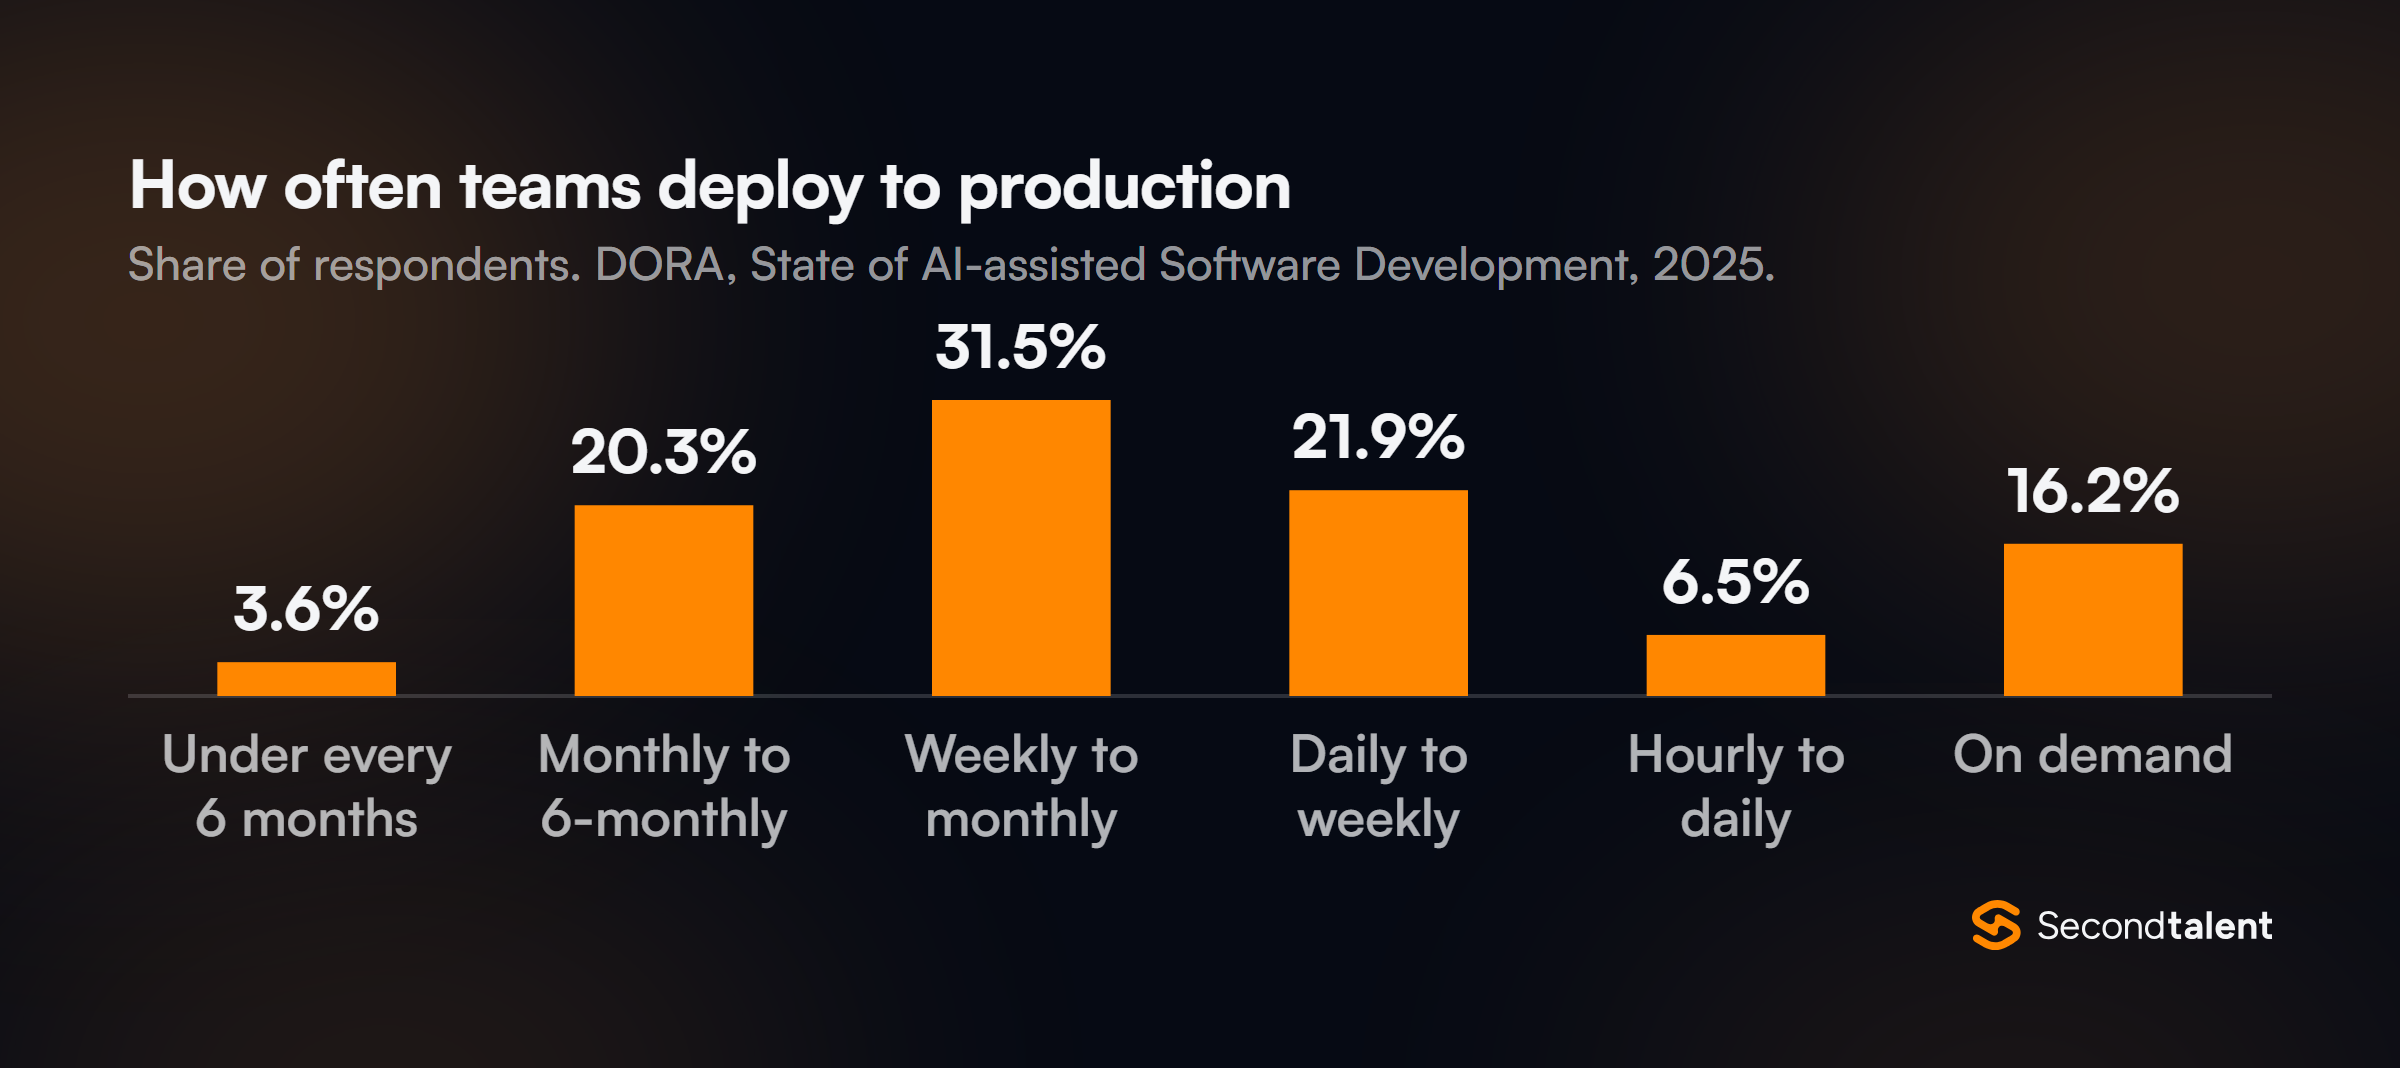
The most common answer in DORA's 2025 survey was between once a week and once a month, given by 31.5% of respondents. Only 16.2% deploy on demand, several times a day.
A high number matters less than what it says about batch size. Teams that deploy daily ship small changes, and small changes are easier to review, test and roll back.
"Working in small batches" is one of the seven capabilities in the AI Capabilities Model that DORA published with its 2025 State of AI-assisted Software Development report, because AI tools amplify whatever batch size a team already works in.
How to measure: successful production deploys per service per day or week, pulled from your deploy tool, not from merged PRs.
Strong result: on demand. At the other end, 3.6% of DORA's respondents deploy less than once every six months.
Watch out for: splitting one release into many trivial deploys to move the number. Read it next to change failure rate.
2. Lead Time for Changes
9.4% ship in under an hour31.9% take one day to one weekCommit to production
Fewer than one team in ten can take a committed change to production within an hour.
Lead time for changes measures that span, from commit to running in production, and in DORA's 2025 data the largest group, 31.9%, needed between one day and one week.
Under 1 hour9.4%
Under 1 day15%
1 day to 1 week31.9%
1 week to 1 month28.3%
1 to 6 months13.2%
Over 6 months2%
Share of respondents by lead time for changes. Source: DORA, State of AI-assisted Software Development, 2025.
Long lead times rarely come from slow typing. They come from queues: a PR waiting for review, a build waiting for a test environment, a release waiting for a change board.
That is why lead time is best read as a total and then split into the stages in metrics 6 and 7, where the waiting shows up.
How to measure: median time from the first commit in a change to its production deploy, per service. DORA's metrics guide defines each of the five terms.
Strong result: under one day. In DORA's data, 24.4% of respondents reach it (the under-one-hour and under-one-day bands combined).
Watch out for: averages. One stuck change skews a mean for weeks, so report the median and the slowest 10%.
3. Change Failure Rate
Elite: under 1%8% to 16% is the most common bandDX Core 4 quality metric
Change failure rate is the metric AI has made worse. It is the share of deployments that cause a failure in production, and the 2025 DORA report found that AI adoption "still increases delivery instability" even as throughput improves.
The year before, DORA estimated a 7.2% rise in instability for every 25% increase in AI adoption.
Telemetry tells the same story at larger scale.
Faros AI tracked 22,000 developers across 4,000 teams for its Q2 2026 AI engineering report: teams with high AI adoption completed 33.7% more tasks than low-adoption teams, but logged 242.7% more incidents per pull request.
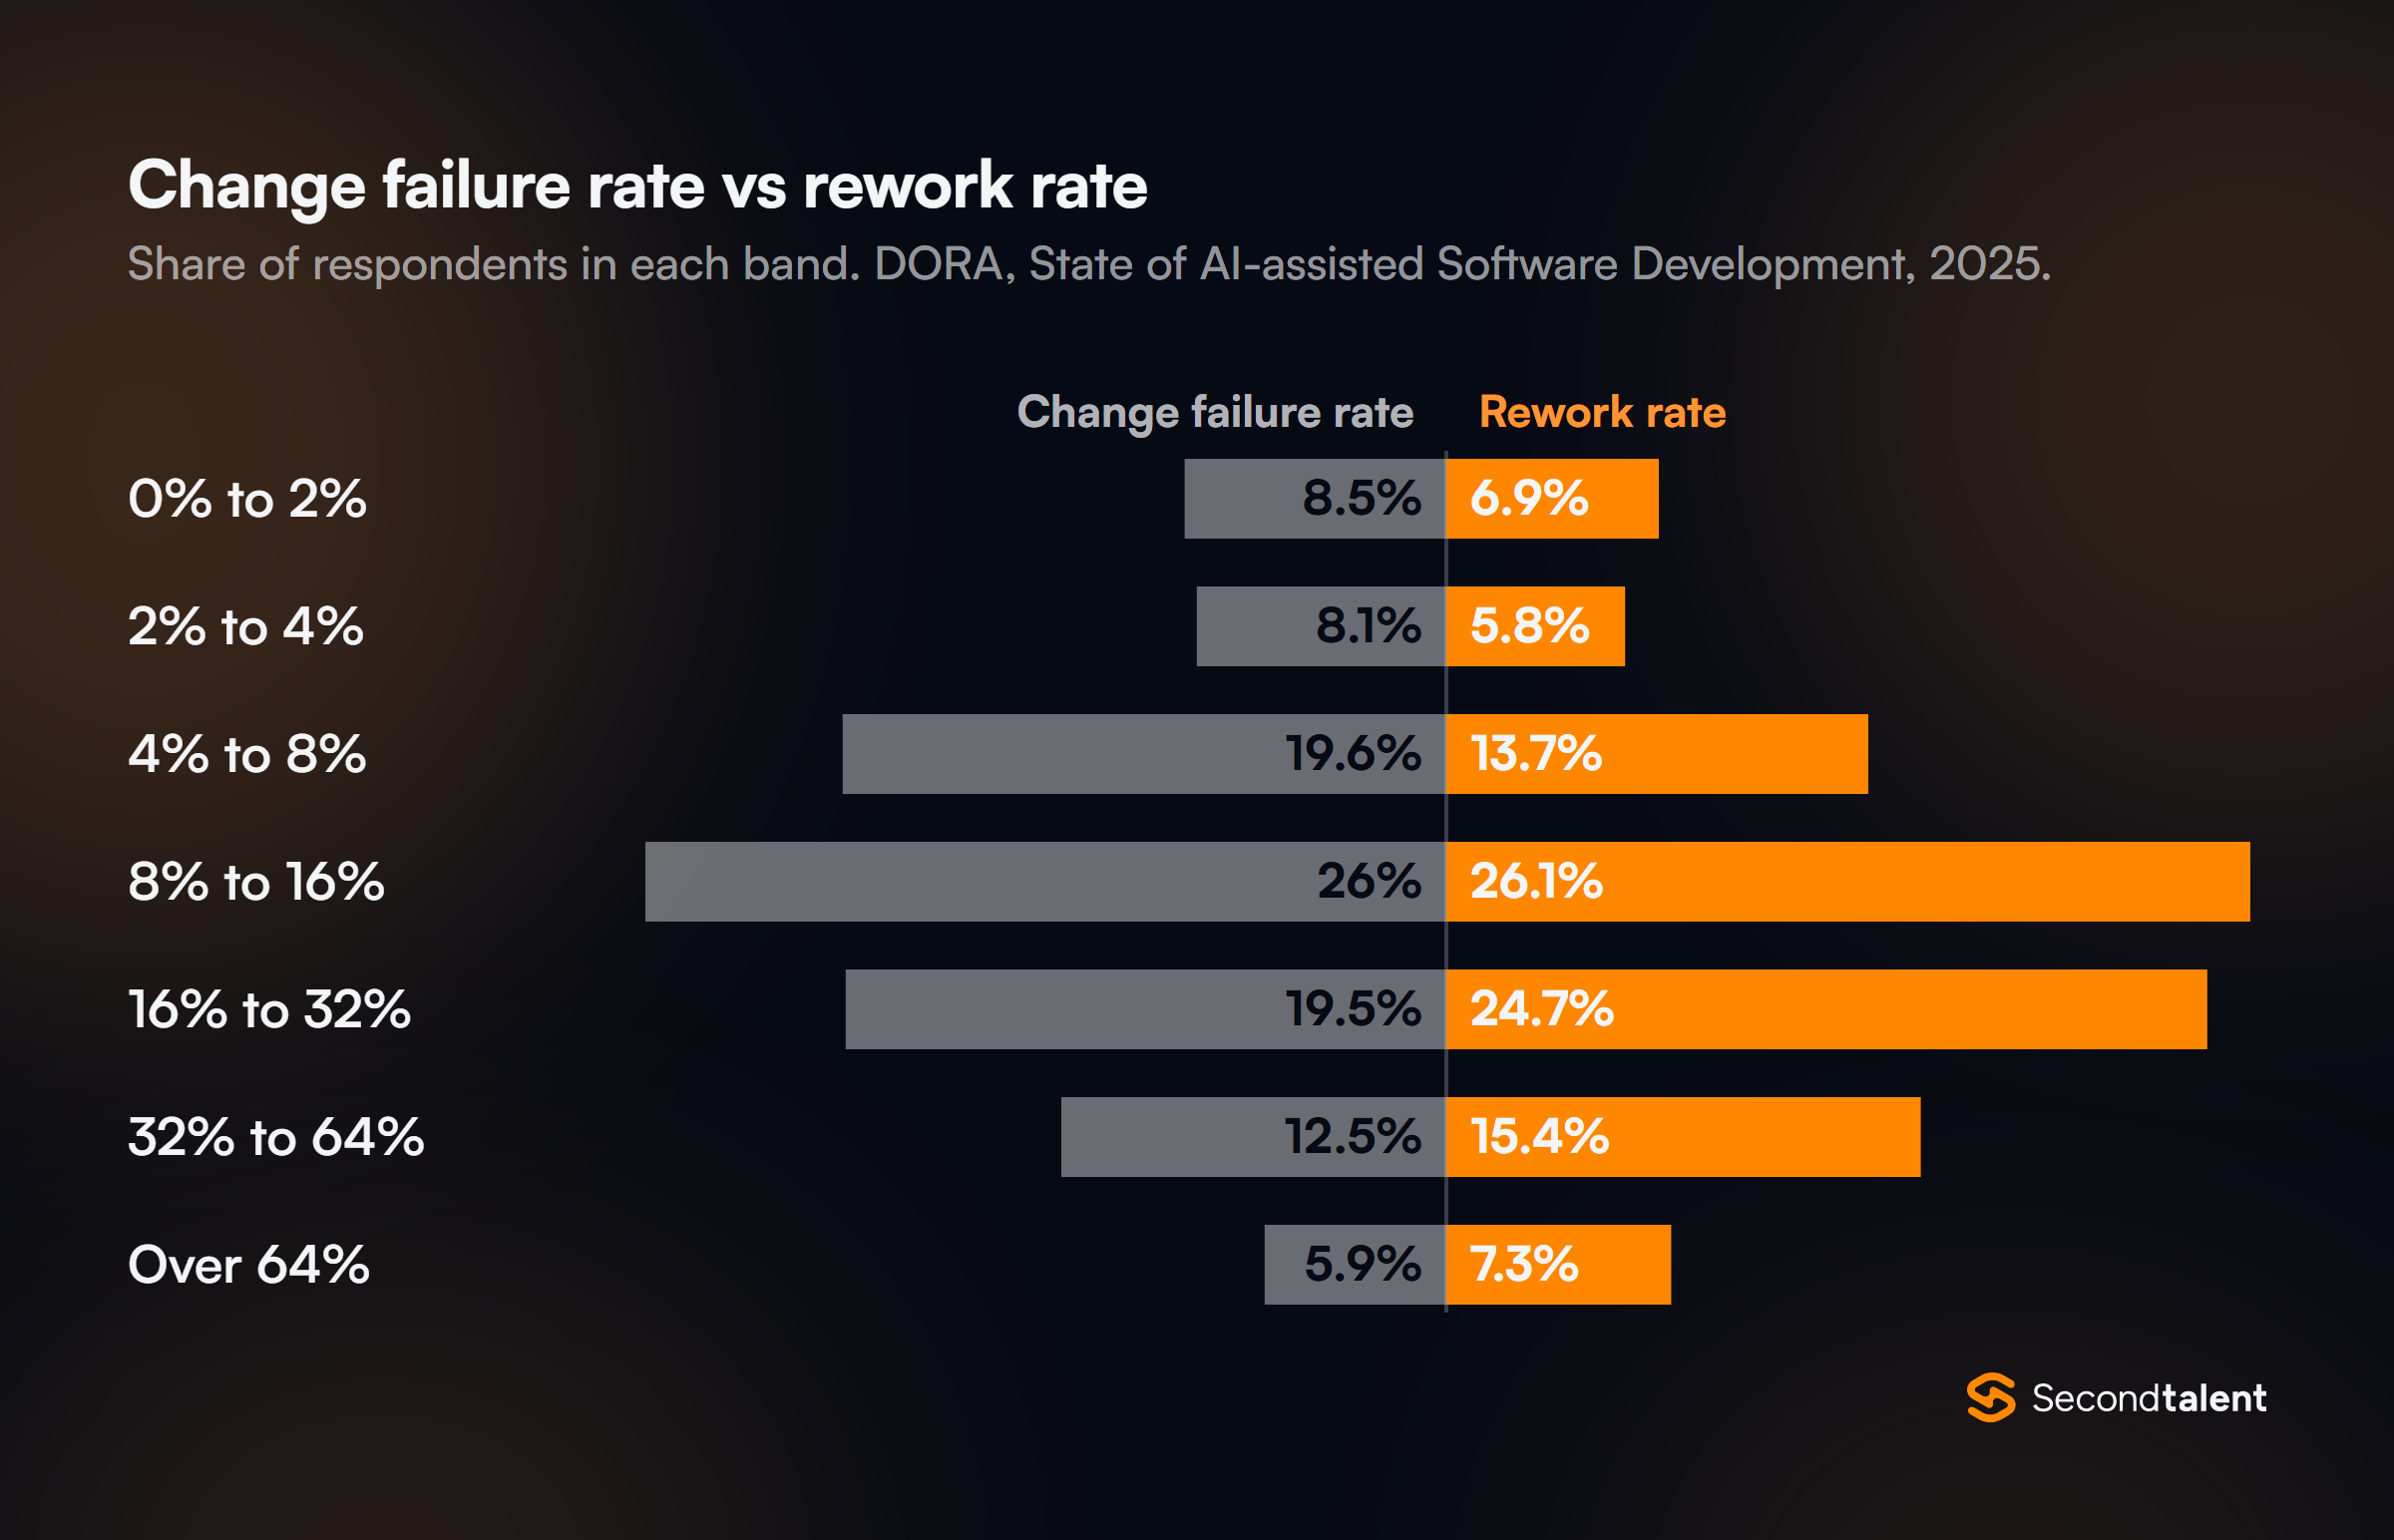
In DORA's survey the most common change failure band was 8% to 16%, reported by 26% of respondents, and 5.9% said more than 64% of their changes fail.
How to measure: deploys that needed a rollback, hotfix or incident response, divided by all deploys in the period.
Strong result: under 1% for LinearB's elite tier; above 17% puts a team in its "needs focus" group.
Watch out for: an incident process that only logs outages. Degraded performance and silent data errors are failures too.
4. Failed Deployment Recovery Time
21.3% recover in under an hour35.3% recover within a dayReplaces MTTR
This used to be called mean time to restore, and DORA has changed it twice. It was renamed to count only the time to recover from a failed deployment, not from any outage, and in 2025 it moved from the stability group into throughput.
A team that can roll back in minutes can afford to ship more often.
Recovery is where most teams do best. In DORA's 2025 survey, 21.3% restore service within an hour of a bad deploy and another 35.3% within a day, while 1% need more than six months.
LinearB dropped recovery time from its 2026 benchmarks altogether, saying the figure varied too much between organizations to compare.
How to measure: time from the failed deploy being detected to the service running normally again, through rollback, fix-forward or feature flag.
Strong result: under one hour, which usually means automated rollback and flags rather than faster debugging.
Watch out for: the older MTTR. Many dashboards still blend infrastructure outages into it, which is not the same measure.
5. Rework Rate
DORA's fifth metric6.9% of teams at 0% to 2%7.3% above 64%
Rework rate is the newest DORA metric and the one most teams are not yet tracking.
DORA defines it as "the ratio of deployments that are unplanned but happen as a result of an incident in production," in other words the patches a team ships because an earlier release broke something.
Together with change failure rate it forms DORA's instability factor.
The two instability metrics have almost the same shape. The 8% to 16% band is the most common for both, and rework runs slightly heavier in the bad tail: 22.7% of respondents report rework above 32%, against 18.4% for change failures.
A team with low change failure but high rework is often hiding failures as "planned" follow-up releases.
How to measure: tag each deploy as planned or unplanned, and count unplanned deploys linked to a production incident.
Strong result: 0% to 2%. LinearB uses its own rework definition, code rewritten soon after it ships, and puts elite teams under 3%.
Watch out for: mixing the two definitions on one dashboard. Say which one a number uses.
6. Cycle Time
From 8.1M pull requests4 stages: coding, pickup, review, deploy
Cycle time is the metric I would put on a dashboard first, because it splits into stages a team can act on.
It runs from the first commit on a branch to its release, and LinearB breaks it into coding time, pickup time, review time and deploy time.
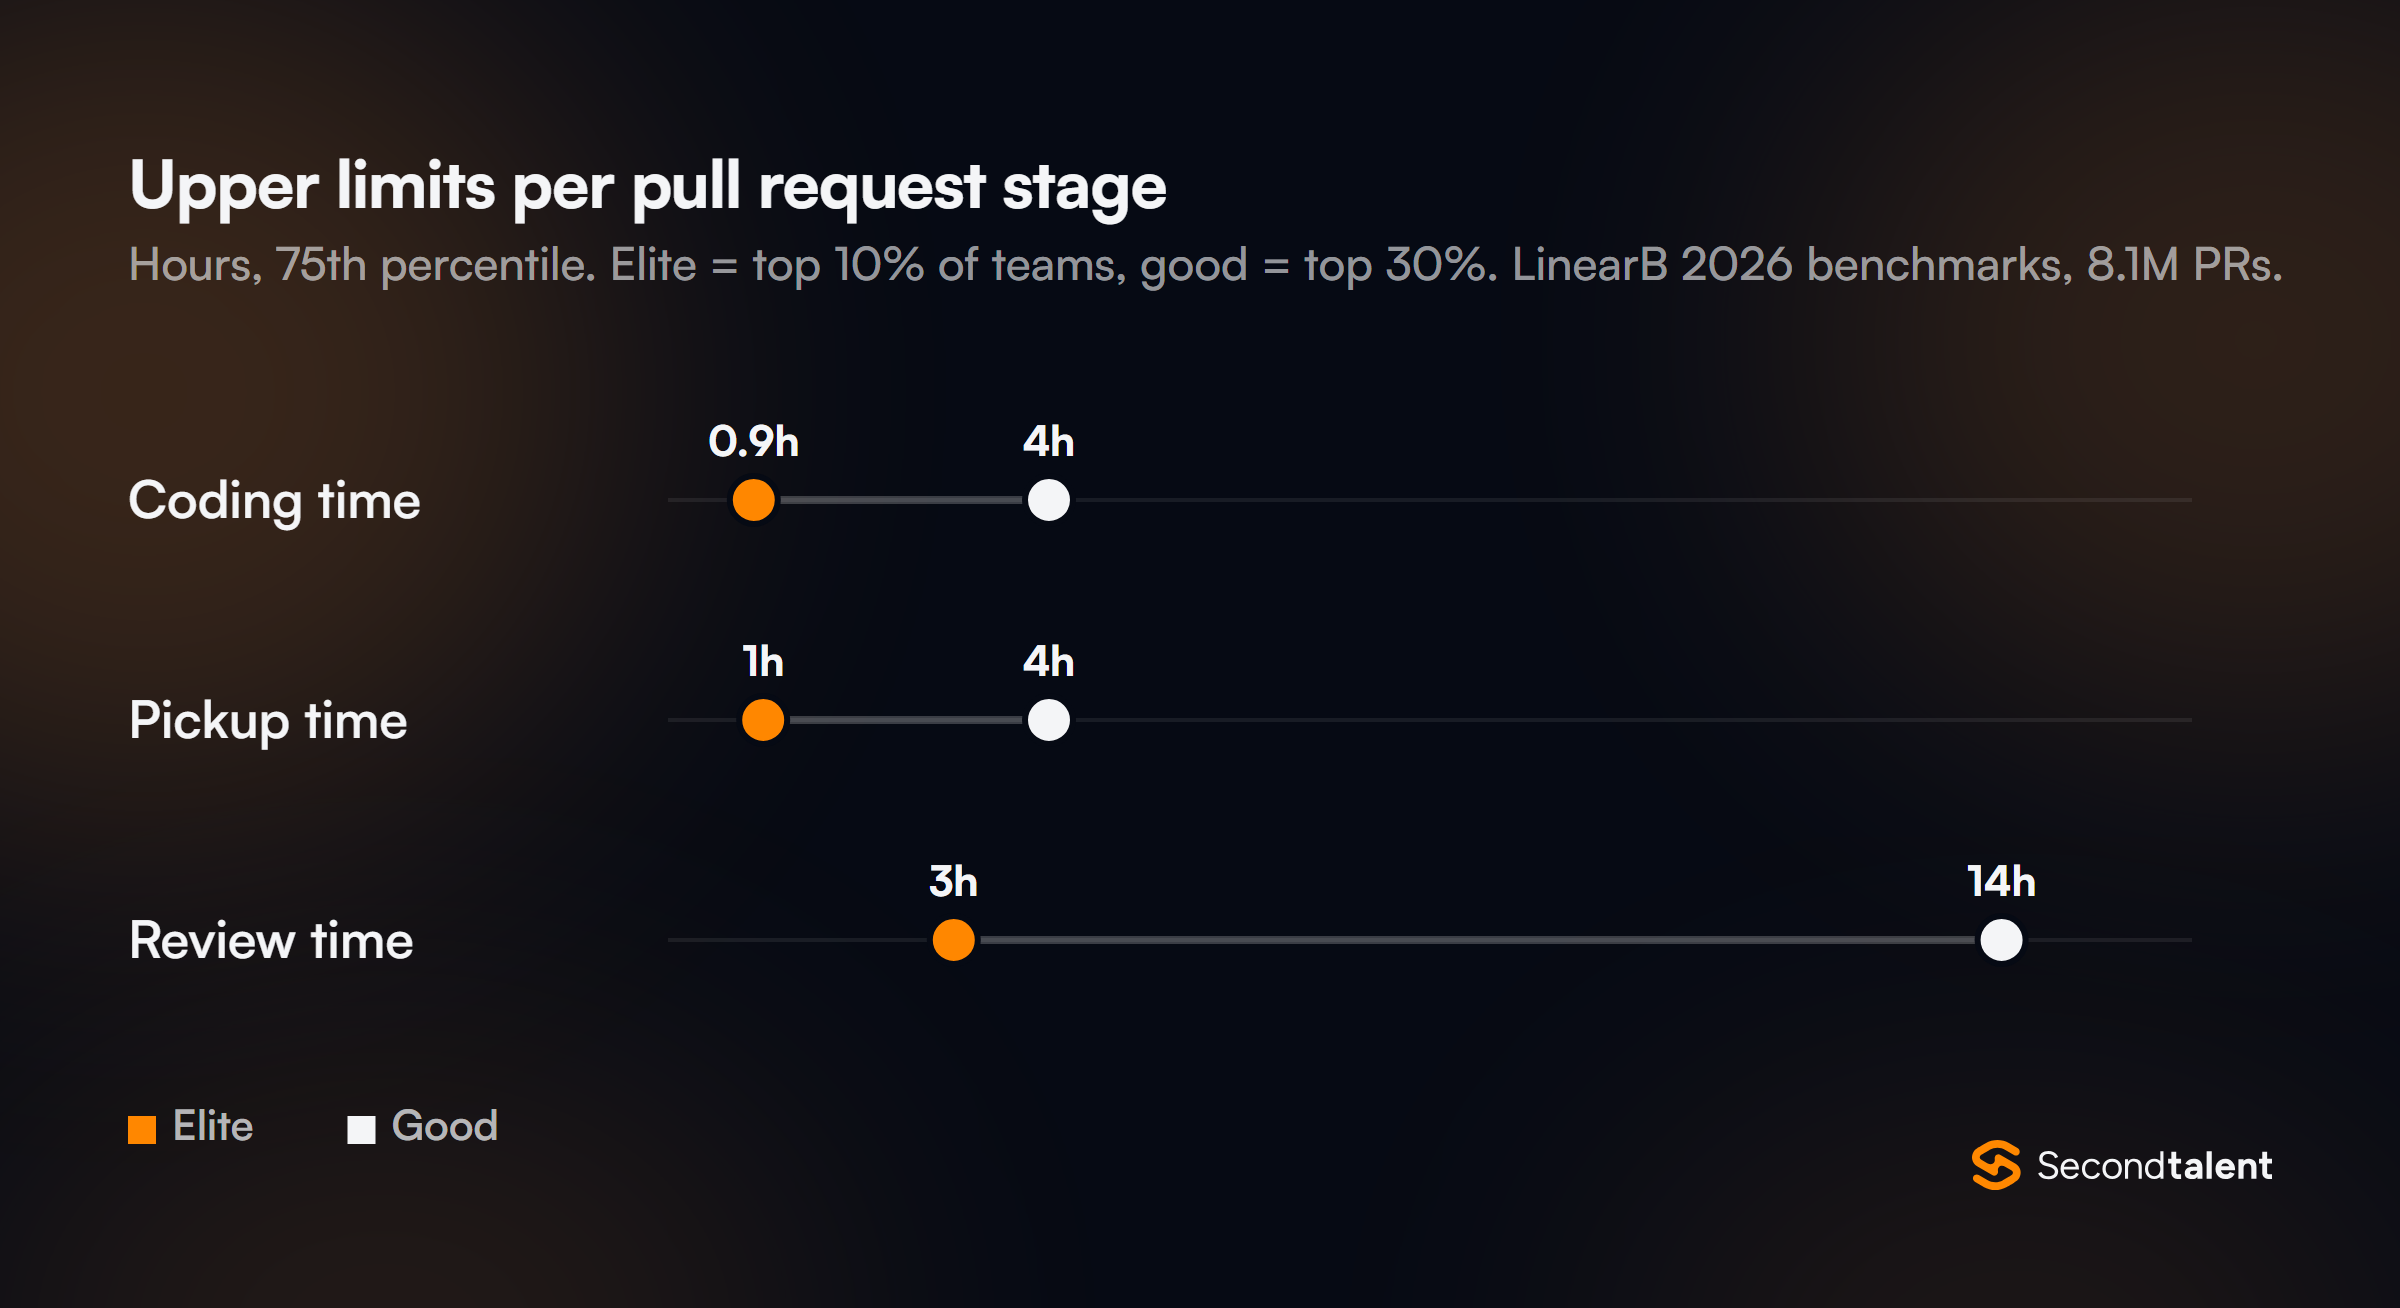
In its 2026 benchmark report, drawn from 163,820 contributors in 42 countries, the tiers look like this.
The stage that dominates is usually deploy, not coding. LinearB's elite line for coding time is under 54 minutes, while elite deploy time is anything under 16 hours, and a "needs focus" team takes more than 277 hours to deploy a merged PR.
If your cycle time is long, look at the release process before you look at the engineers.
How to measure: per pull request, from first commit to production, with each of the four stages timed separately.
Strong result: under 25 hours at the 75th percentile, LinearB's elite threshold.
Watch out for: comparing individuals. Cycle time is a team and system metric; ranking people on it rewards cherry-picking easy tickets.
7. Review Pickup and Review Time
Agentic PRs wait 5.3x longerGoogle median review: under 4 hours
Code review is where AI-era pull requests pile up. Pickup time is how long a PR waits for its first reviewer, and review time runs from that first look to approval.
Faros AI's 2025 study of more than 10,000 developers found that teams with high AI adoption merged 98% more pull requests, while PR review time rose 91%. Code generation sped up; human review did not.
Google set the reference point years before AI coding tools.
Its study of about 9 million code changes found authors waited a median of under an hour for first feedback on small changes and about 5 hours on very large ones, with the whole review taking under 4 hours at the median.
Fewer than 25% of changes had more than one reviewer. If review is your bottleneck, our comparison of AI code review tools covers what can take the first pass.
How to measure: PR opened (or marked ready) to first review comment, then first comment to approval, from your Git host's API.
Strong result: pickup under 1 hour and review under 3 hours, LinearB's elite lines.
Watch out for: rubber stamps. Fast approvals on 1,000-line PRs make this metric look great and change failure rate look terrible.
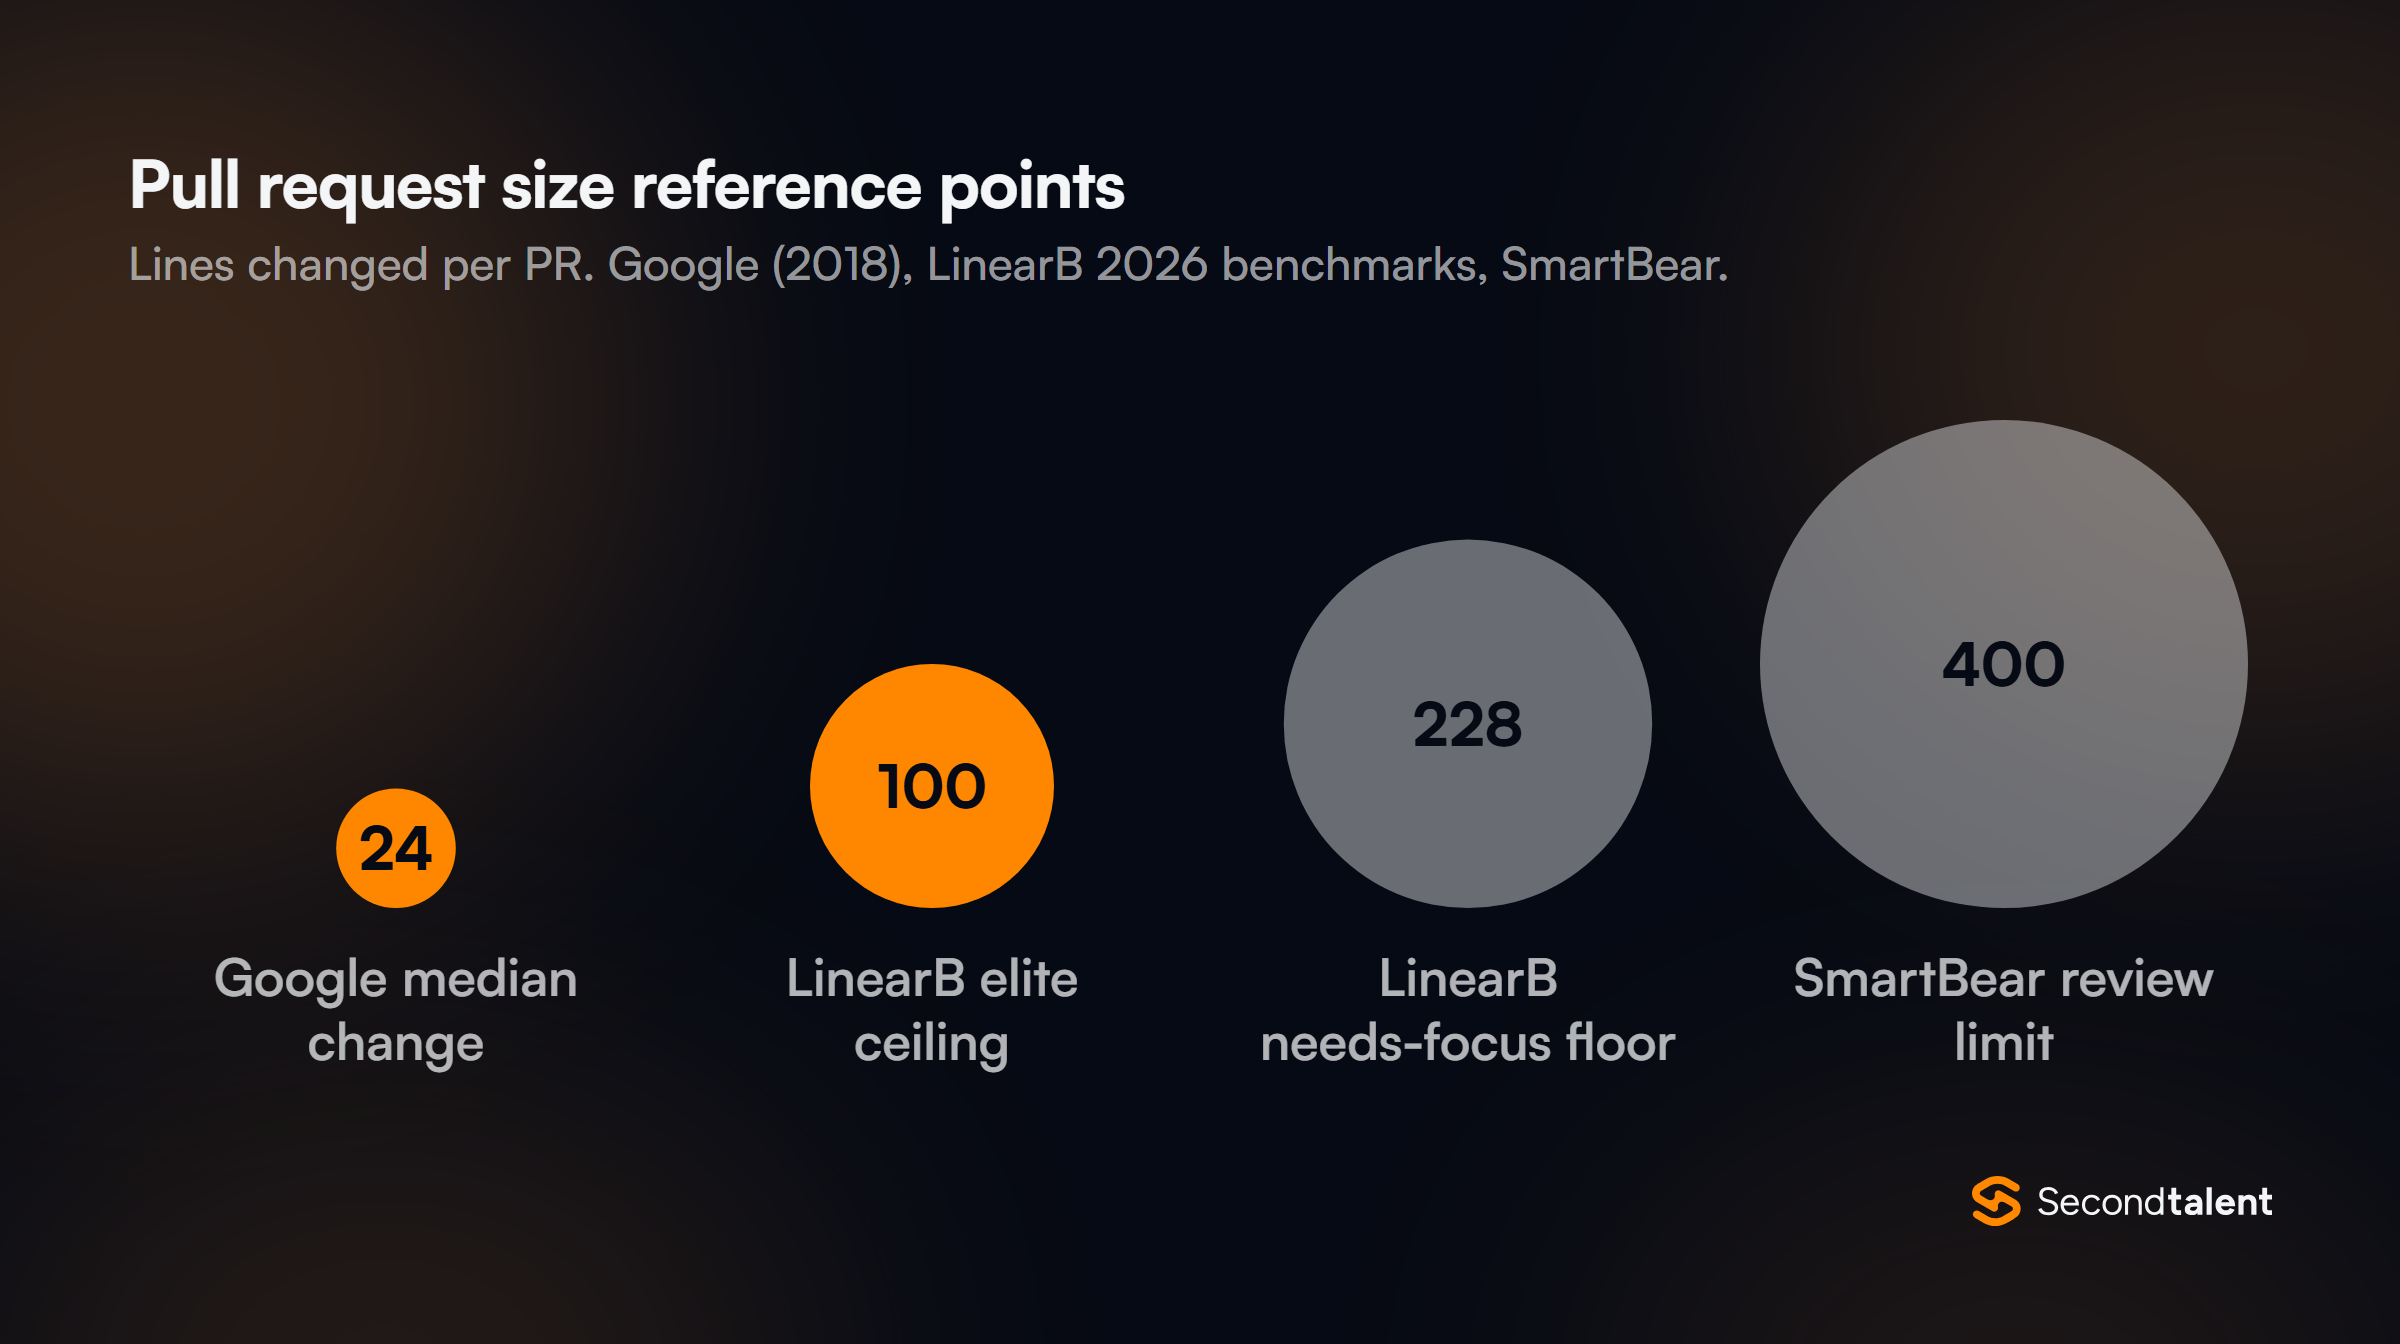
PR size is the cheapest leading indicator on this list. The median change at Google modified 24 lines, and LinearB's elite teams keep PRs under 100 code changes, while anything above 228 lands in "needs focus."
Small PRs get reviewed faster, fail less and roll back cleanly, so this one number moves metrics 3, 6 and 7 with it.
AI is pushing the number the wrong way. LinearB measured AI-assisted PRs at 2.6 times the size of unassisted ones, and accepted only 32.7% of AI-generated PRs against 84.4% of manual ones.
How to measure: lines added plus lines deleted per PR, excluding generated files, lockfiles and vendored code.
Strong result: under 100 changes at the 75th percentile.
Watch out for: stacked PRs that split one risky change into five dependent ones. Size drops; risk does not.
9. Developer Experience Index (DXI)
13 minutes a week per DXI pointAtlassian bought DX for about $1B
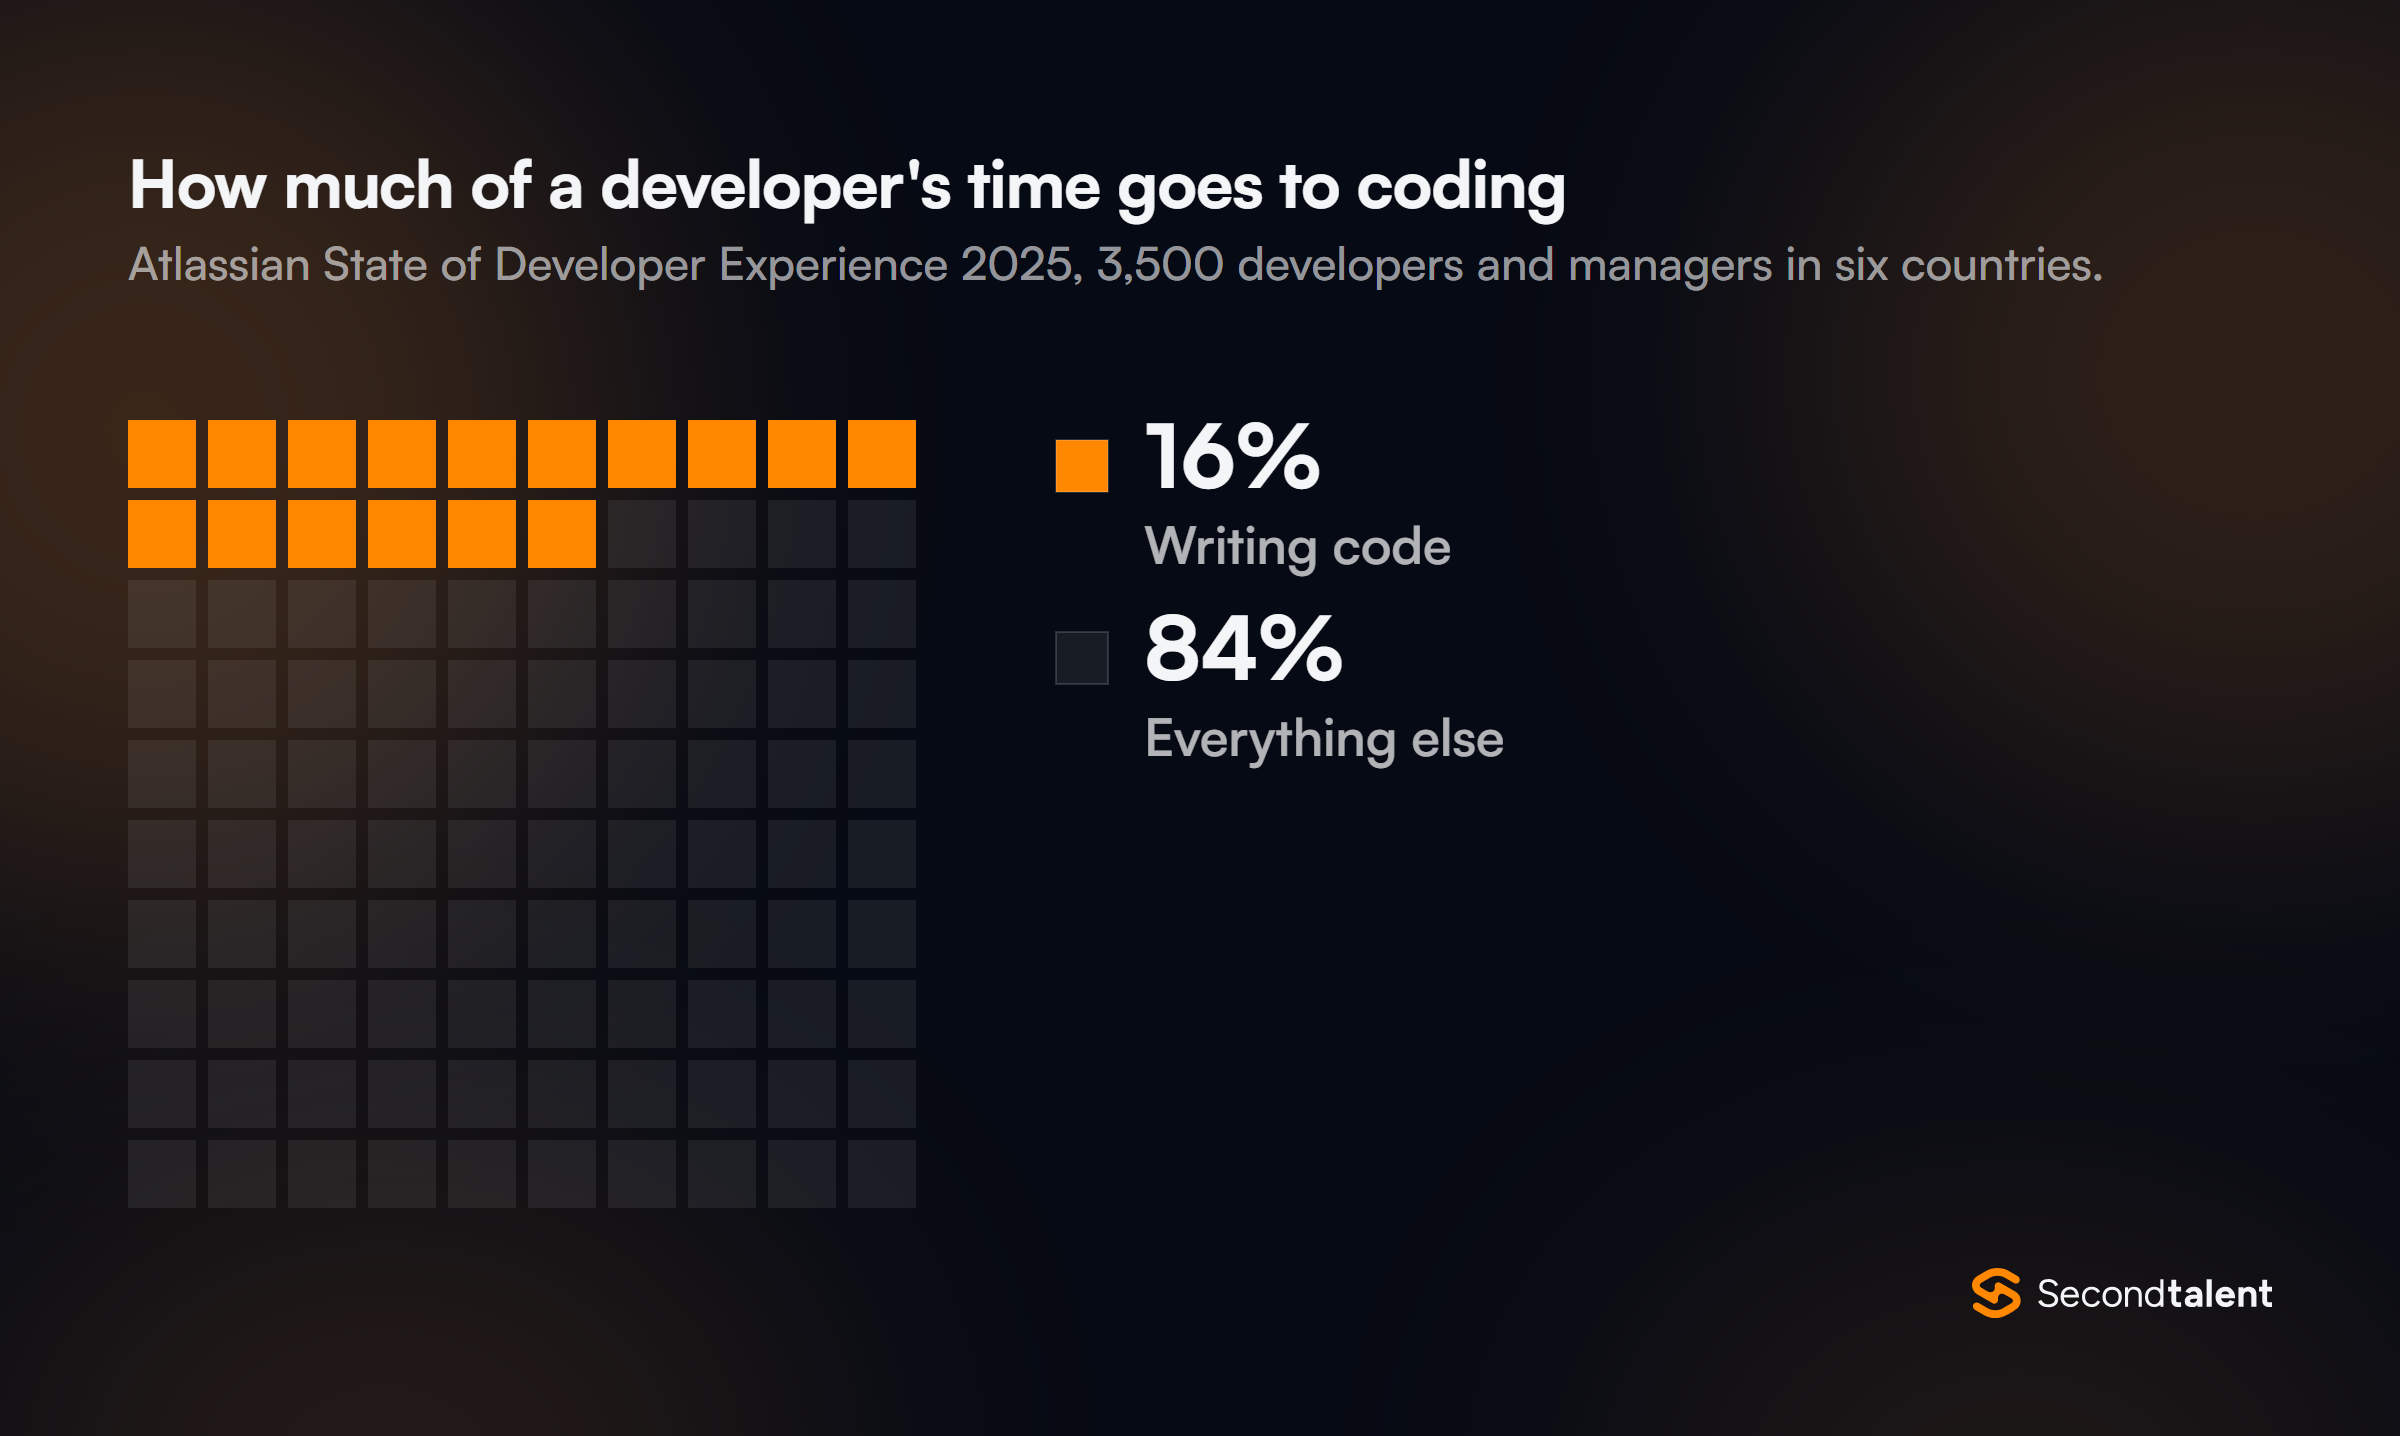
Developers spend about 16% of their time writing code, according to Atlassian's 2025 survey of 3,500 developers and managers. The other 84% is where developer experience metrics look.
The best known is DX's Developer Experience Index, a survey score built on the DevEx framework's three dimensions: feedback loops, cognitive load and flow state.
DX says in its DXI report that each one-point gain "correlates to 13 minutes per week of developer time saved," based on research with 40,000 developers across 800 organizations.
The DXI is the effectiveness pillar of the DX Core 4, next to diffs per engineer, change failure rate and the share of time spent on new capabilities. Atlassian agreed to buy DX for about $1 billion in September 2025, per its SEC filing.
Large companies outside the DX customer base tend to run their own surveys instead. SAP, for instance, publishes no developer experience scorecard.
Its public signal is the annual Developer Insights Survey, answered by 589 developers in 44 countries in 2026.
In the 2025 edition, about 74% said they were "very satisfied" or "satisfied" with development work on SAP, and SAP Community guidance for BTP extension teams points them to DORA metrics for delivery.
How to measure: a quarterly survey of 10 to 20 questions on build speed, review waits, documentation and interruptions, paired with the system metrics above.
Strong result: a rising score and a falling count of hours lost. In Atlassian's 2025 data, 50% of developers lost 10 or more hours a week to inefficiencies.
Watch out for: surveys with no follow-up. Atlassian found 63% of developers say leaders do not understand their pain points.
10. Net AI Time Savings
19% slower with AI in METR's 2025 trial65% regularly correct AI output
In METR's July 2025 trial, 16 experienced open-source developers took 19% longer on real issues when AI tools were allowed, yet afterwards believed AI had made them 20% faster.
A follow-up in February 2026 with 57 developers pointed to speedups, but METR called its own new data an "unreliable signal" that likely understates the gain.
The lesson for measurement holds either way: self-reported AI savings are not evidence.
DX's AI Measurement Framework gives the cleanest formula. It tracks utilization, impact and cost, and its cost dimension includes "net time gain per developer," time saved minus AI spend.
GitHub's Copilot usage metrics API supplies the utilization side, from daily active users to PRs merged and median time to merge. The trend lines below show why the net figure matters more than the gross one.
What developers report, 2026
87% say AI helps them ship faster
60% say AI usage is treated as a productivity signal
What it costs them
72% have the same or more friction than before AI
41% sometimes use AI more than needed because it is expected
How to measure: hours saved per developer per week from a short survey, checked against cycle time and change failure rate for the same teams, minus license and token spend.
Strong result: a positive net figure that survives the review and rework AI code creates. Our AI coding assistant statistics track adoption by tool.
Watch out for: counting AI usage itself as output. Atlassian's 2026 data shows developers inflate usage when they think it is being watched.
Who Hits These Numbers
All ten metrics come back to small changes reviewed quickly by engineers who know the codebase.
If review queues or thin DevOps cover are holding your numbers back, more seniority on the team usually moves them faster than another dashboard.
For teams that need to scale their engineering capacity without compromising productivity, flexible staffing arrangements can also be useful.
A Labour hire agreement can clearly define the responsibilities and terms when external engineers are engaged through a staffing provider.
Second Talent helps US startups hire vetted AI-Native Engineers and Specialists from Asia, at $23 to $39 an hour, matched in 24 hours, with a 90-day replacement guarantee.
Are DORA metrics still the right engineering productivity metrics in 2026?
For delivery, yes, in their 2025 form of five metrics. They do not measure developer experience or AI payoff, which is why frameworks such as SPACE, DevEx and the DX Core 4 add survey data alongside them.
DORA has not published a 2026 State of DevOps survey report.
What tools track engineering productivity metrics?
LinearB lists DORA metrics from $29 per contributor a month. Swarmia is free for up to 9 developers, then $45. Haystack starts at $20 per member. DX, Jellyfish and Span quote on request.
Span positions itself on linking AI agent sessions to code and PRs, DX on survey-backed frameworks. Our guide to AI developer productivity tools covers the coding side.
Should you measure individual developer productivity?
Not with these metrics. DX marks diffs per engineer "not at individual level" and warns against tying targets or rewards to it. Use team-level numbers to find bottlenecks, and one-to-ones for individual performance.
Matt Li is a tech-driven entrepreneur with deep expertise in global talent strategy, digital experience optimization, e-commerce, and Web3 innovation.
He is the Co-Founder of Second Talent, a US-based company that connects businesses with top-tier tech professionals worldwide. Since launching the company in 2024, Matt has led its growth by leveraging technology to streamline remote hiring and scale distributed teams.
With a background spanning product, operations, and innovation, Matt brings a cross-disciplinary perspective to the evolving digital economy. His work sits at the intersection of global talent, emerging technology, and scalable digital transformation.