TL;DR: An AI sourcing dashboard should track ten numbers: qualified pipeline yield, reply rate, time to shortlist, hiring manager acceptance, interview to offer by source, offer acceptance, source of hire, cost per hire, adverse impact ratio and quality of hire tied back to the match score. Cut every one by role and by channel, and keep AI-sourced candidates as their own segment. Without that split you cannot tell what the tool added.
Hiring teams ran 20 interviews per hire in 2024, up from 14 in 2021, and average time to hire rose from 33 to 41 days, according to Gem’s 2025 Recruiting Benchmarks Report. AI sourcing tools sell themselves on fixing the top of that funnel.
The dashboard is how you check whether they did, role by role.
- 1A sourced applicant is 5 times more likely to be hired than an inbound one, on Gem’s data.
- 2Job boards and social sites bring 49.0% of applications but only 24.6% of hires.
- 3New York City bars an automated hiring tool unless it had a bias audit within the past year.
- 4SHRM puts the 2025 median cost per hire at $1,200 for nonexecutive roles.
Internal AI sourcing dashboard vs the view hiring managers and clients see
An AI sourcing dashboard usually starts as an internal report for the talent team: match scores, reply rates, pipeline counts by role.
Then hiring managers ask to see their own requisitions, and agencies start sharing a version with clients. That second audience decides which of the 10 metrics below go on screen, and how they have to be built.
| Aspect | Internal BI | Customer-Facing Analytics |
|---|---|---|
| Users | Employees who know the business | Customers with varied expertise and goals |
| Tolerance for friction | Moderate: users must use it | Low: poor experience affects retention |
| Security model | Role-based within one organization | Strict data isolation between many customers |
| Scale | Dozens to hundreds of users | Potentially thousands of concurrent users |
| Design standards | Functional | Must match product brand and UX |
| Business impact | Better internal decisions | Product value, differentiation, revenue |
For a recruiting team, the customers are hiring managers and, at an agency, client companies.
Each client must see only its own roles and AI-sourced candidates, and candidate data is personal data, so a leak between clients is a breach, not a bug.
A hiring manager also needs plain labels: “shortlist accepted” instead of an internal stage code, and one line explaining what the tool’s match score means, so a score of 87 is not read as a hiring recommendation.
When clients log in to the dashboard, it becomes a product feature, and it needs product skills: user research, information design, a tenant security model and query performance as candidate data grows.
Teams without that in house often bring in data visualization consulting services with experience building analytics into products, not only internal BI.
The 10 metrics every AI sourcing dashboard should track
I group them in the order a candidate moves: the first four measure the sourcing itself, the next three measure what happens to sourced people later in the funnel, and the last three measure cost, fairness and whether the hires were any good.
Each one needs a segment filter for AI-sourced, recruiter-sourced, inbound and referral candidates.
1. Qualified pipeline yield
This is the share of profiles the tool surfaces that a recruiter marks as worth contacting. It is the first test of the match model, and the one vendors rarely show you.
A tool that returns 400 profiles with 20 usable ones costs recruiter hours, even if the search felt instant.
Log the reject reason when a recruiter passes on a profile: wrong seniority, wrong location, stale profile, missing must-have skill. After a month the reasons tell you whether to fix the search brief or the tool.
Our review of AI sourcing tools for recruiters shows how differently the main tools handle filters for location and seniority.
2. Reply rate on outreach
Count replies per candidate across the whole sequence, not per email. A three-step sequence with one reply is one reply.
Then split positive replies from "not now" and "unsubscribe", because AI-written messages can lift raw replies while lowering the share that turn into calls.
Compare AI-drafted messages with recruiter-written ones on the same role and the same week.
Published averages vary too much to use as a target: vendors define a reply differently and rarely say how they handle bounces or auto-responders, so your own baseline is the benchmark that counts.
3. Time to first qualified shortlist
Speed is the main reason teams buy AI sourcing, so measure it where the tool acts: the days between the intake meeting and the first shortlist a hiring manager accepts. Gem’s numbers show why the later stages matter too.
Teams now run more interviews per hire, so a faster shortlist can still end in a slower hire.
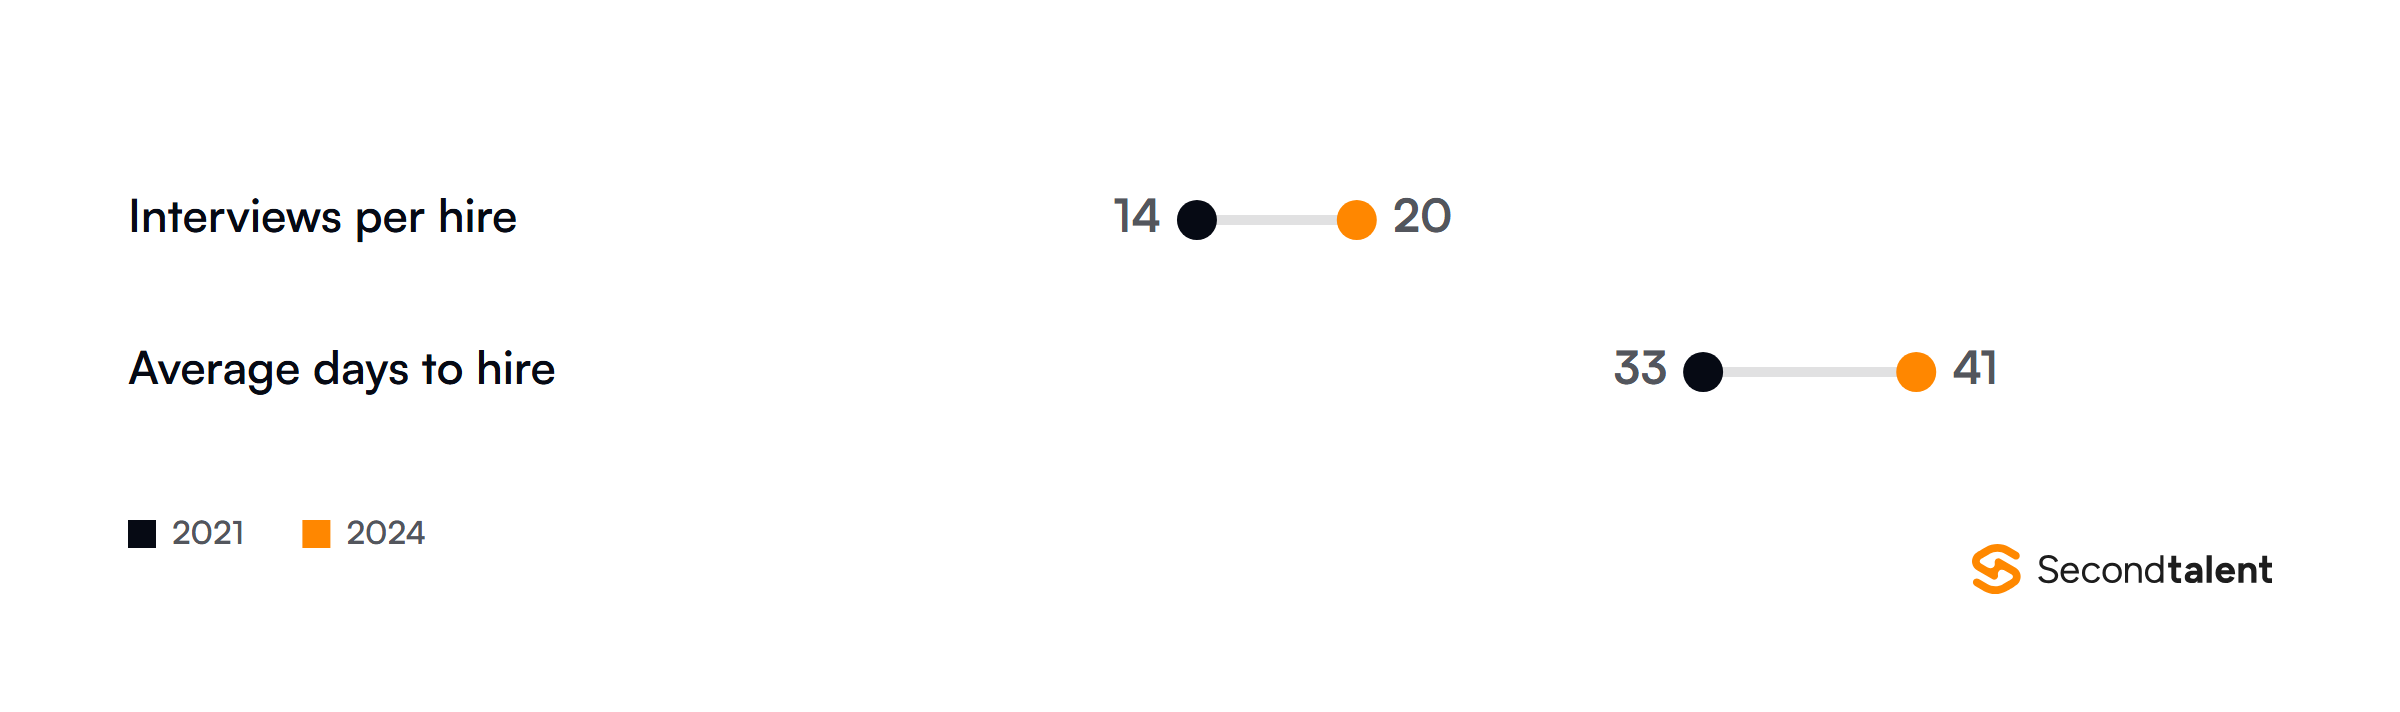
Track both clocks on one panel. If time to shortlist falls and time to hire does not, the delay has moved to interviews or approvals, and more sourcing will not fix it. Our time to hire calculator breaks the second clock into stages.
4. Hiring manager acceptance rate
Recruiters can like a profile that hiring managers do not. This metric is the share of submitted candidates a hiring manager moves to an interview.
When it is low for AI-sourced candidates and normal for recruiter-sourced ones, the match criteria in the tool do not reflect what the manager actually screens for.
Ask managers for one reject reason per candidate, picked from a short fixed list. Free text never gets aggregated. Five reasons, such as skills gap, level, pay expectations, location and communication, are enough to retrain a search.
5. Interview to offer ratio by source
This is where sourced candidates usually prove their value. Gem found a sourced (outbound) applicant is 5 times more likely to be hired than an inbound applicant.
A tool that floods the top of the funnel but lowers this ratio is creating interview load, not hires.
The rediscovery figure matters for your dashboard design. If your AI tool searches your own ATS as well as the open web, tag which pool each candidate came from. Otherwise the tool takes credit for people you already had.
6. Offer acceptance rate
Offer acceptance tells you whether the tool found people who wanted the job, not only people who matched it. Passive candidates found by outreach often have weaker intent than applicants, so read this rate by source.
A low rate for AI-sourced candidates usually points to pay or location mismatches the search should have filtered out.
Record the decline reason on every lost offer. Pay, counteroffer, location and role scope cover most of them, and each one maps back to a field in your sourcing brief.
7. Source of hire mix
Inbound applications still produce the most hires. Ashby’s Talent Trends data puts inbound at 43% to 52% of all hires over four years, with referrals steady at about 17%.
The useful view is the gap between where applications come from and where hires come from.
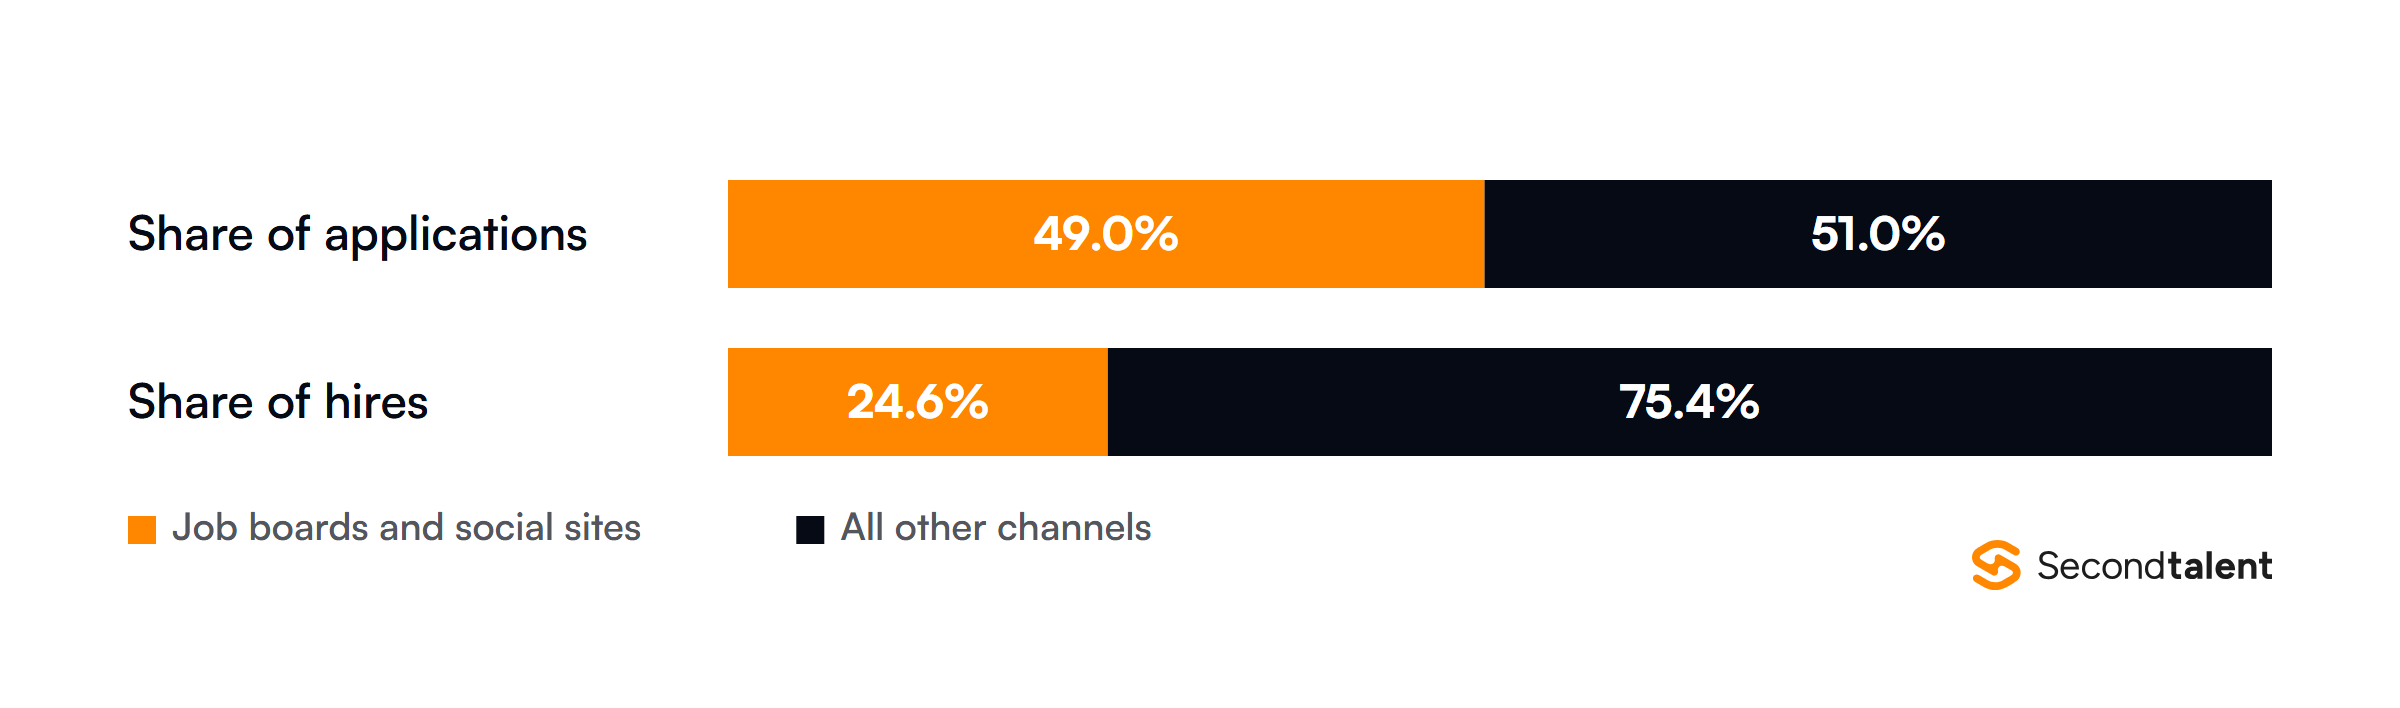
That gap is why the dashboard needs both shares side by side.
A channel with a big share of applications and a small share of hires is costing screening time, and that is usually where an AI tool gets switched on to fix the screening load instead of the sourcing.
8. Cost per qualified candidate and cost per hire
Cost per hire is internal plus external recruiting costs divided by hires. The SHRM 2025 Recruiting Benchmarking report shows the two ends of the market moving in opposite directions since 2017.
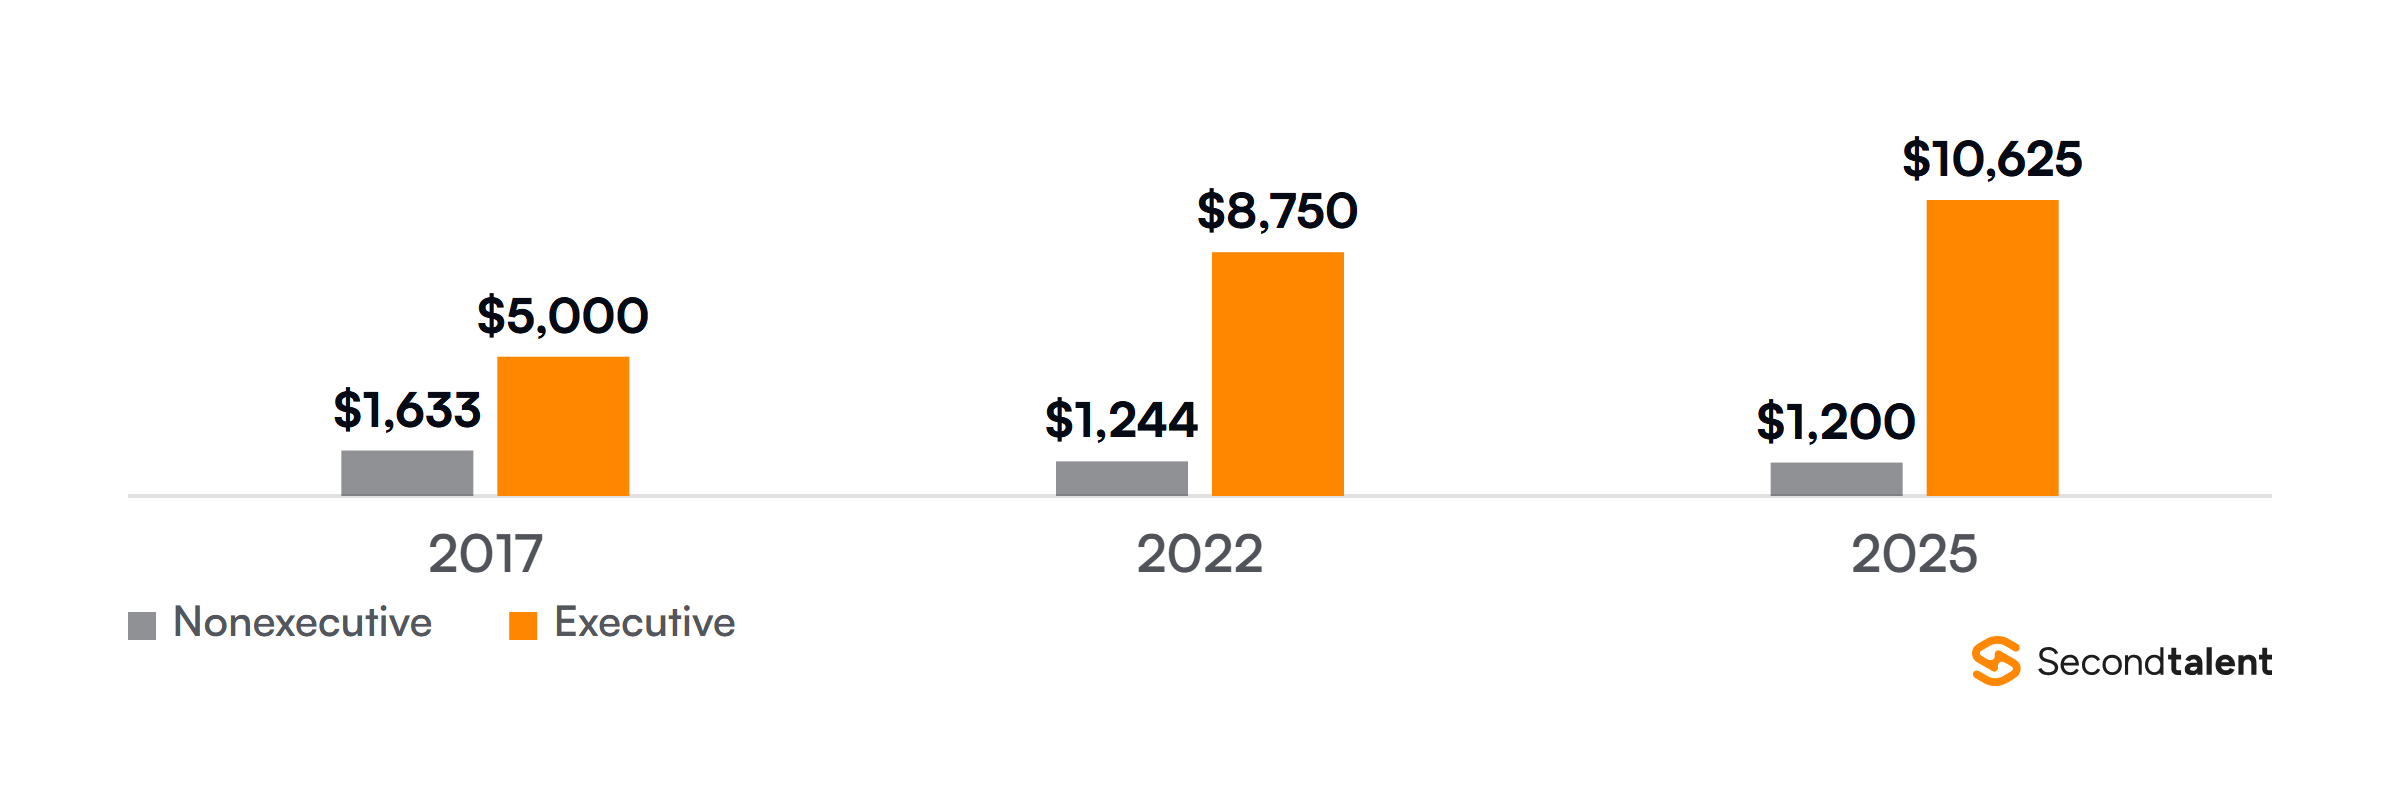
Add a second line for cost per qualified candidate, which is tool licence plus recruiter time divided by qualified candidates. It moves weeks before cost per hire does, so it is the early warning that a tool is not paying for itself.
Our AI recruitment tools cost comparison lists the licence prices to plug in.
9. Adverse impact ratio
Any tool that ranks or screens candidates needs a fairness metric on the dashboard, not in a yearly report.
The US federal guidelines, at 29 CFR 1607.4, treat a selection rate for any race, sex or ethnic group below four fifths of the highest group’s rate as evidence of adverse impact.
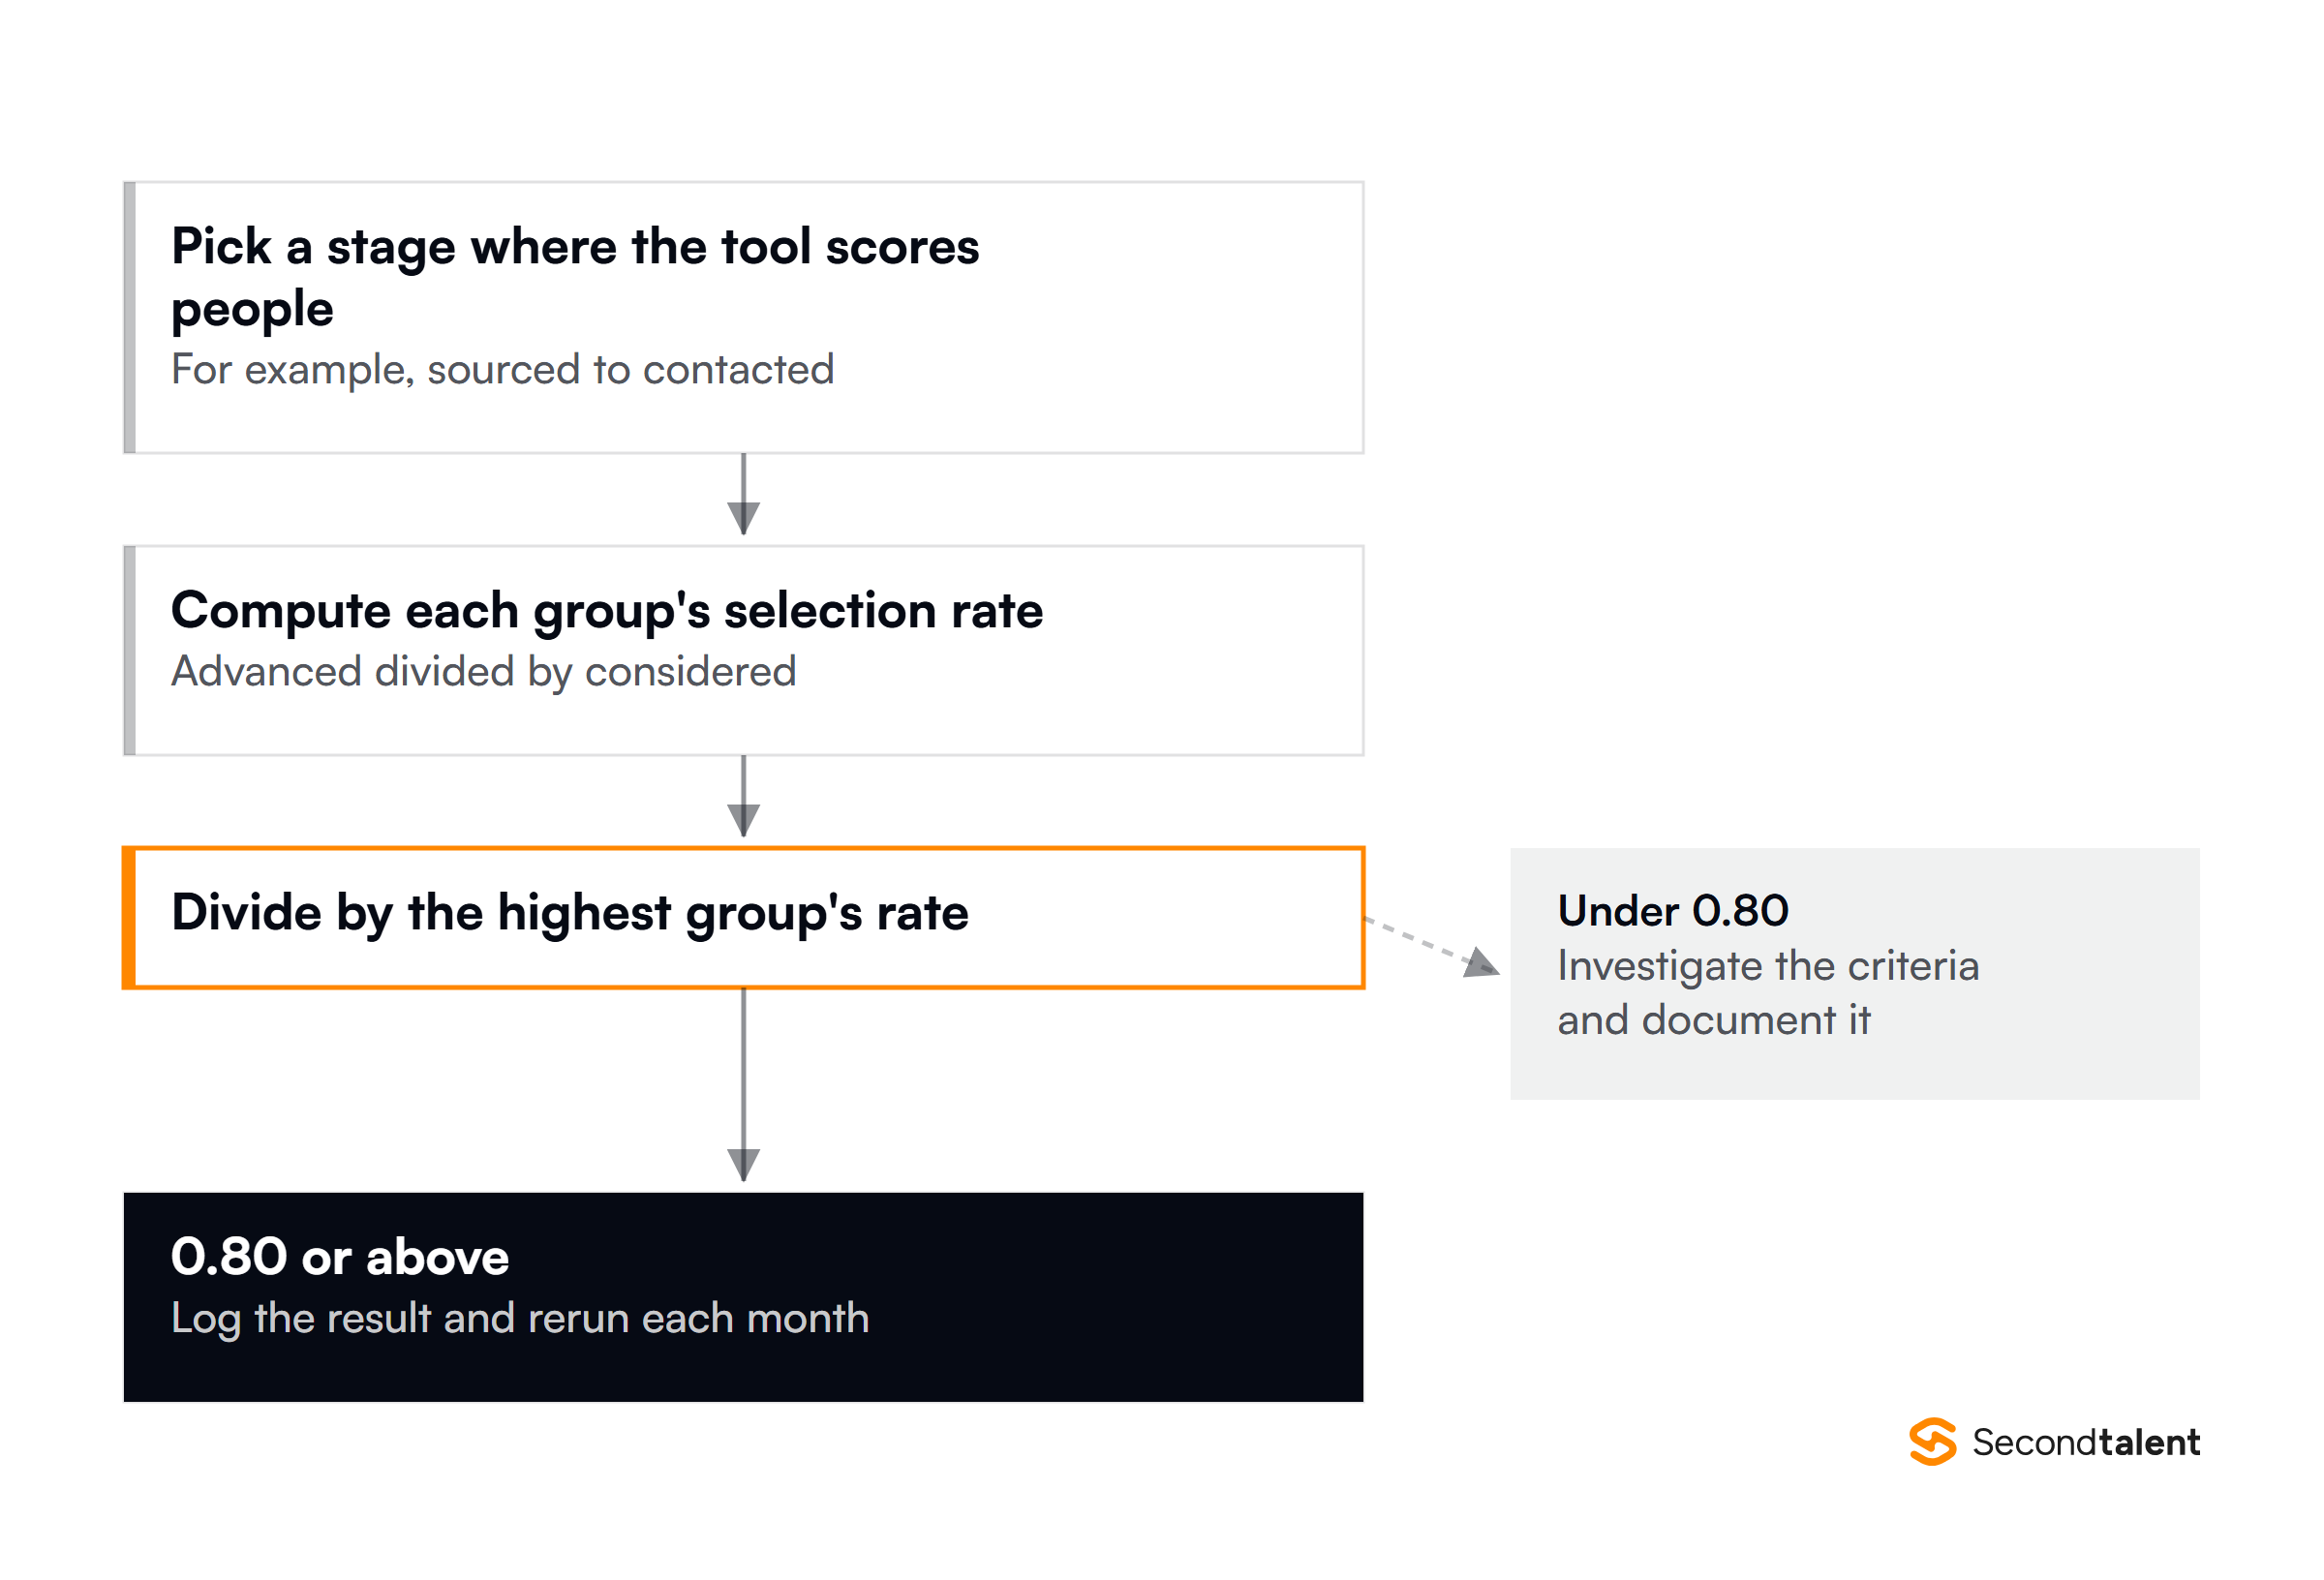
Regulation is catching up with the tools. New York City bars employers from using an automated employment decision tool unless it had a bias audit within one year of use, with the results posted publicly.
The EU AI Act lists AI used to place job ads, filter applications and evaluate candidates as high risk in Annex III. Run the ratio at every stage where the tool scores people, not only at hire.
10. Quality of hire, tied back to the match score
Quality of hire closes the loop.
Pick two or three signals you already collect, such as 90-day retention, the manager’s rating at review time and time to first shipped work, and join them back to the match score the tool gave the person when they were sourced.
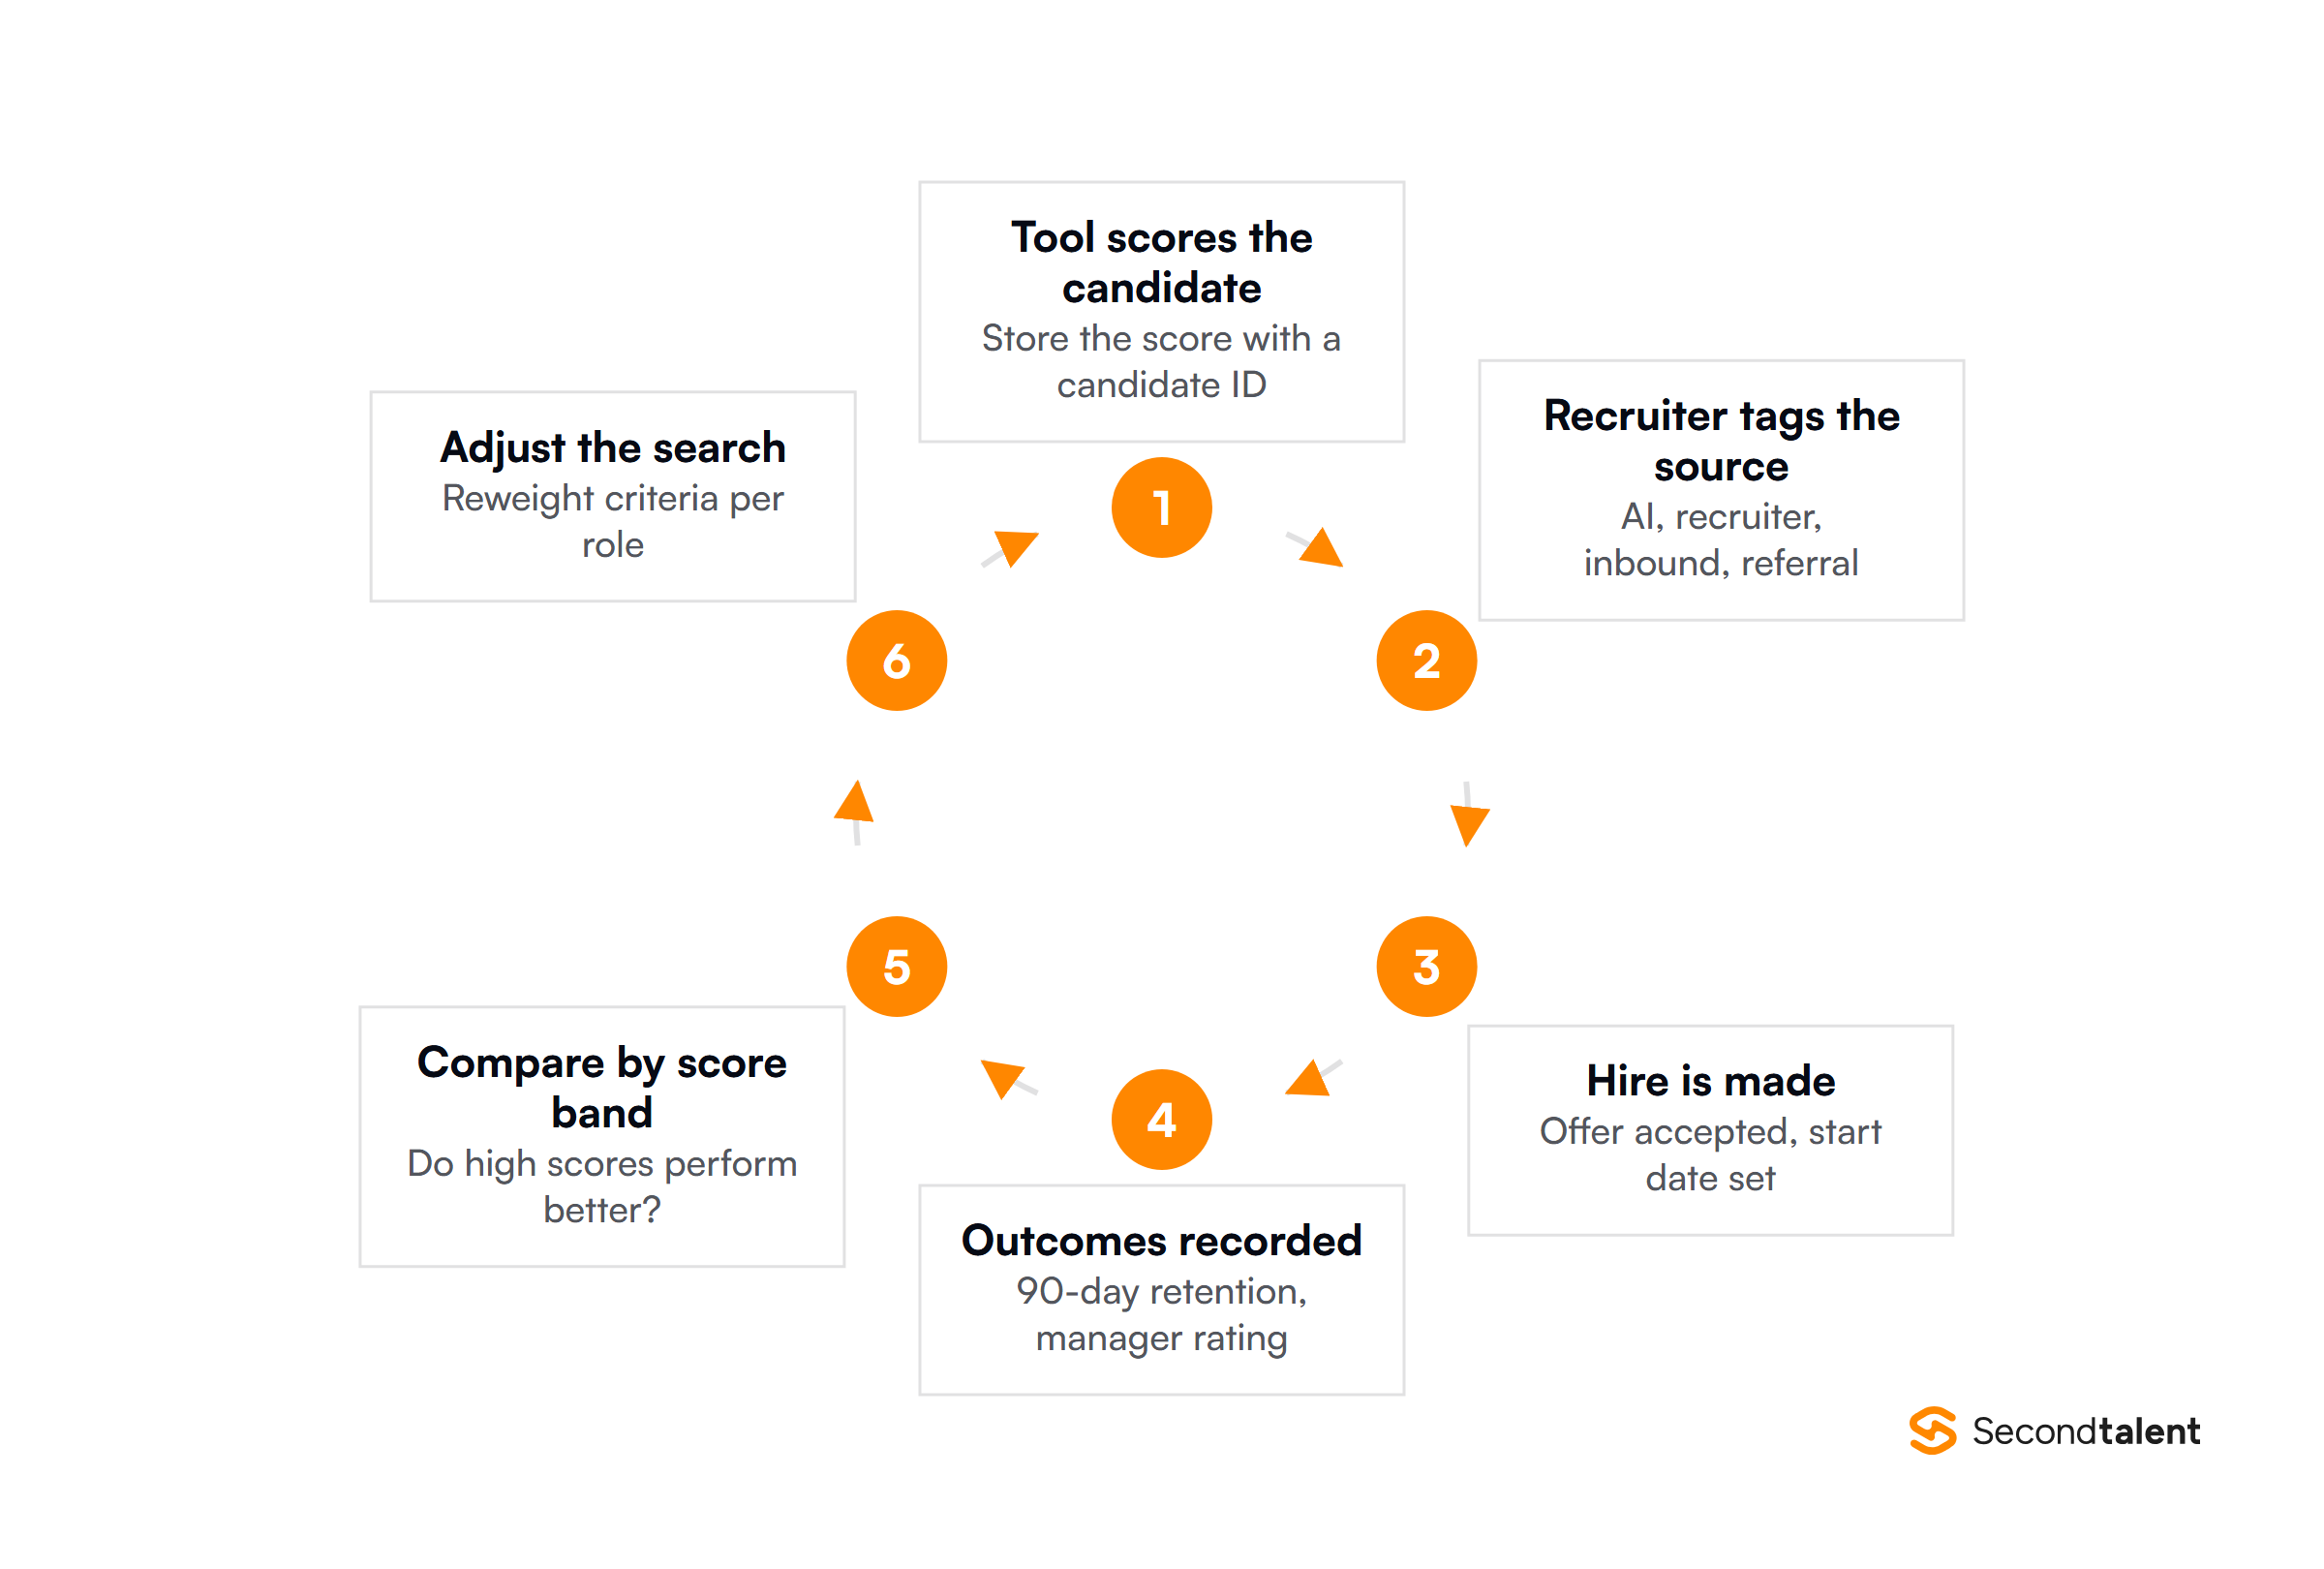
If high-scoring candidates do not perform better than mid-scoring ones, the score is not measuring what matters for that role. That is the most useful finding a dashboard can produce, and it depends on one join.
It takes a shared candidate ID between the sourcing tool and the HR system, so ask for it in the vendor contract. Our AI in recruitment statistics page tracks how teams use these tools.
Common mistakes when building the dashboard
- Showing hiring managers the internal view. Stage codes and recruiter shorthand confuse people outside the talent team. Build a separate, shorter view.
- Tracking every metric the tool exports. Vendors export dozens. Ten, segmented by source, beat fifty that nobody reads.
- No source tag on AI-sourced candidates. Without it, the tool’s results blend into recruiter work and you cannot judge the renewal.
- Adding the fairness check after launch. The adverse impact ratio needs demographic data handled carefully from the first day, not bolted on before an audit.
- No usage tracking on the dashboard itself. If managers never open it, the numbers do not change any decision.
A phased build keeps each of these in check. Start with three or four views for one team, build the data model and access rules, run it with a pilot group of hiring managers for a month, then add metrics they actually ask for.
The top AI recruiting tools differ a lot in what they export, so check the data available before you design the screens.
Hire engineers who can build it
Building the joins behind metrics 9 and 10 takes data engineering time most talent teams do not have. We place pre-vetted data engineers and full-stack developers from Asia who can connect your sourcing tool, ATS and HR system.
See what offshore recruitment costs, or tell us the roles you need to fill.
FAQ
What is the most important metric for an AI sourcing tool?
Interview to offer ratio by source. It shows whether AI-sourced candidates turn into hires at the same rate as candidates from other channels, which is the outcome you are paying for.
How often should the dashboard refresh?
Daily for pipeline and reply metrics, which recruiters act on every day. Weekly or monthly for offer, cost and quality metrics, which need enough hires to mean anything.
Do I need a bias audit if I am not in New York City?
Local Law 144 applies to jobs in New York City, but the four-fifths test comes from US federal guidelines that apply more widely, and the EU AI Act classes recruitment AI as high risk.
Running the ratio yourself is cheaper than finding a problem in an audit.