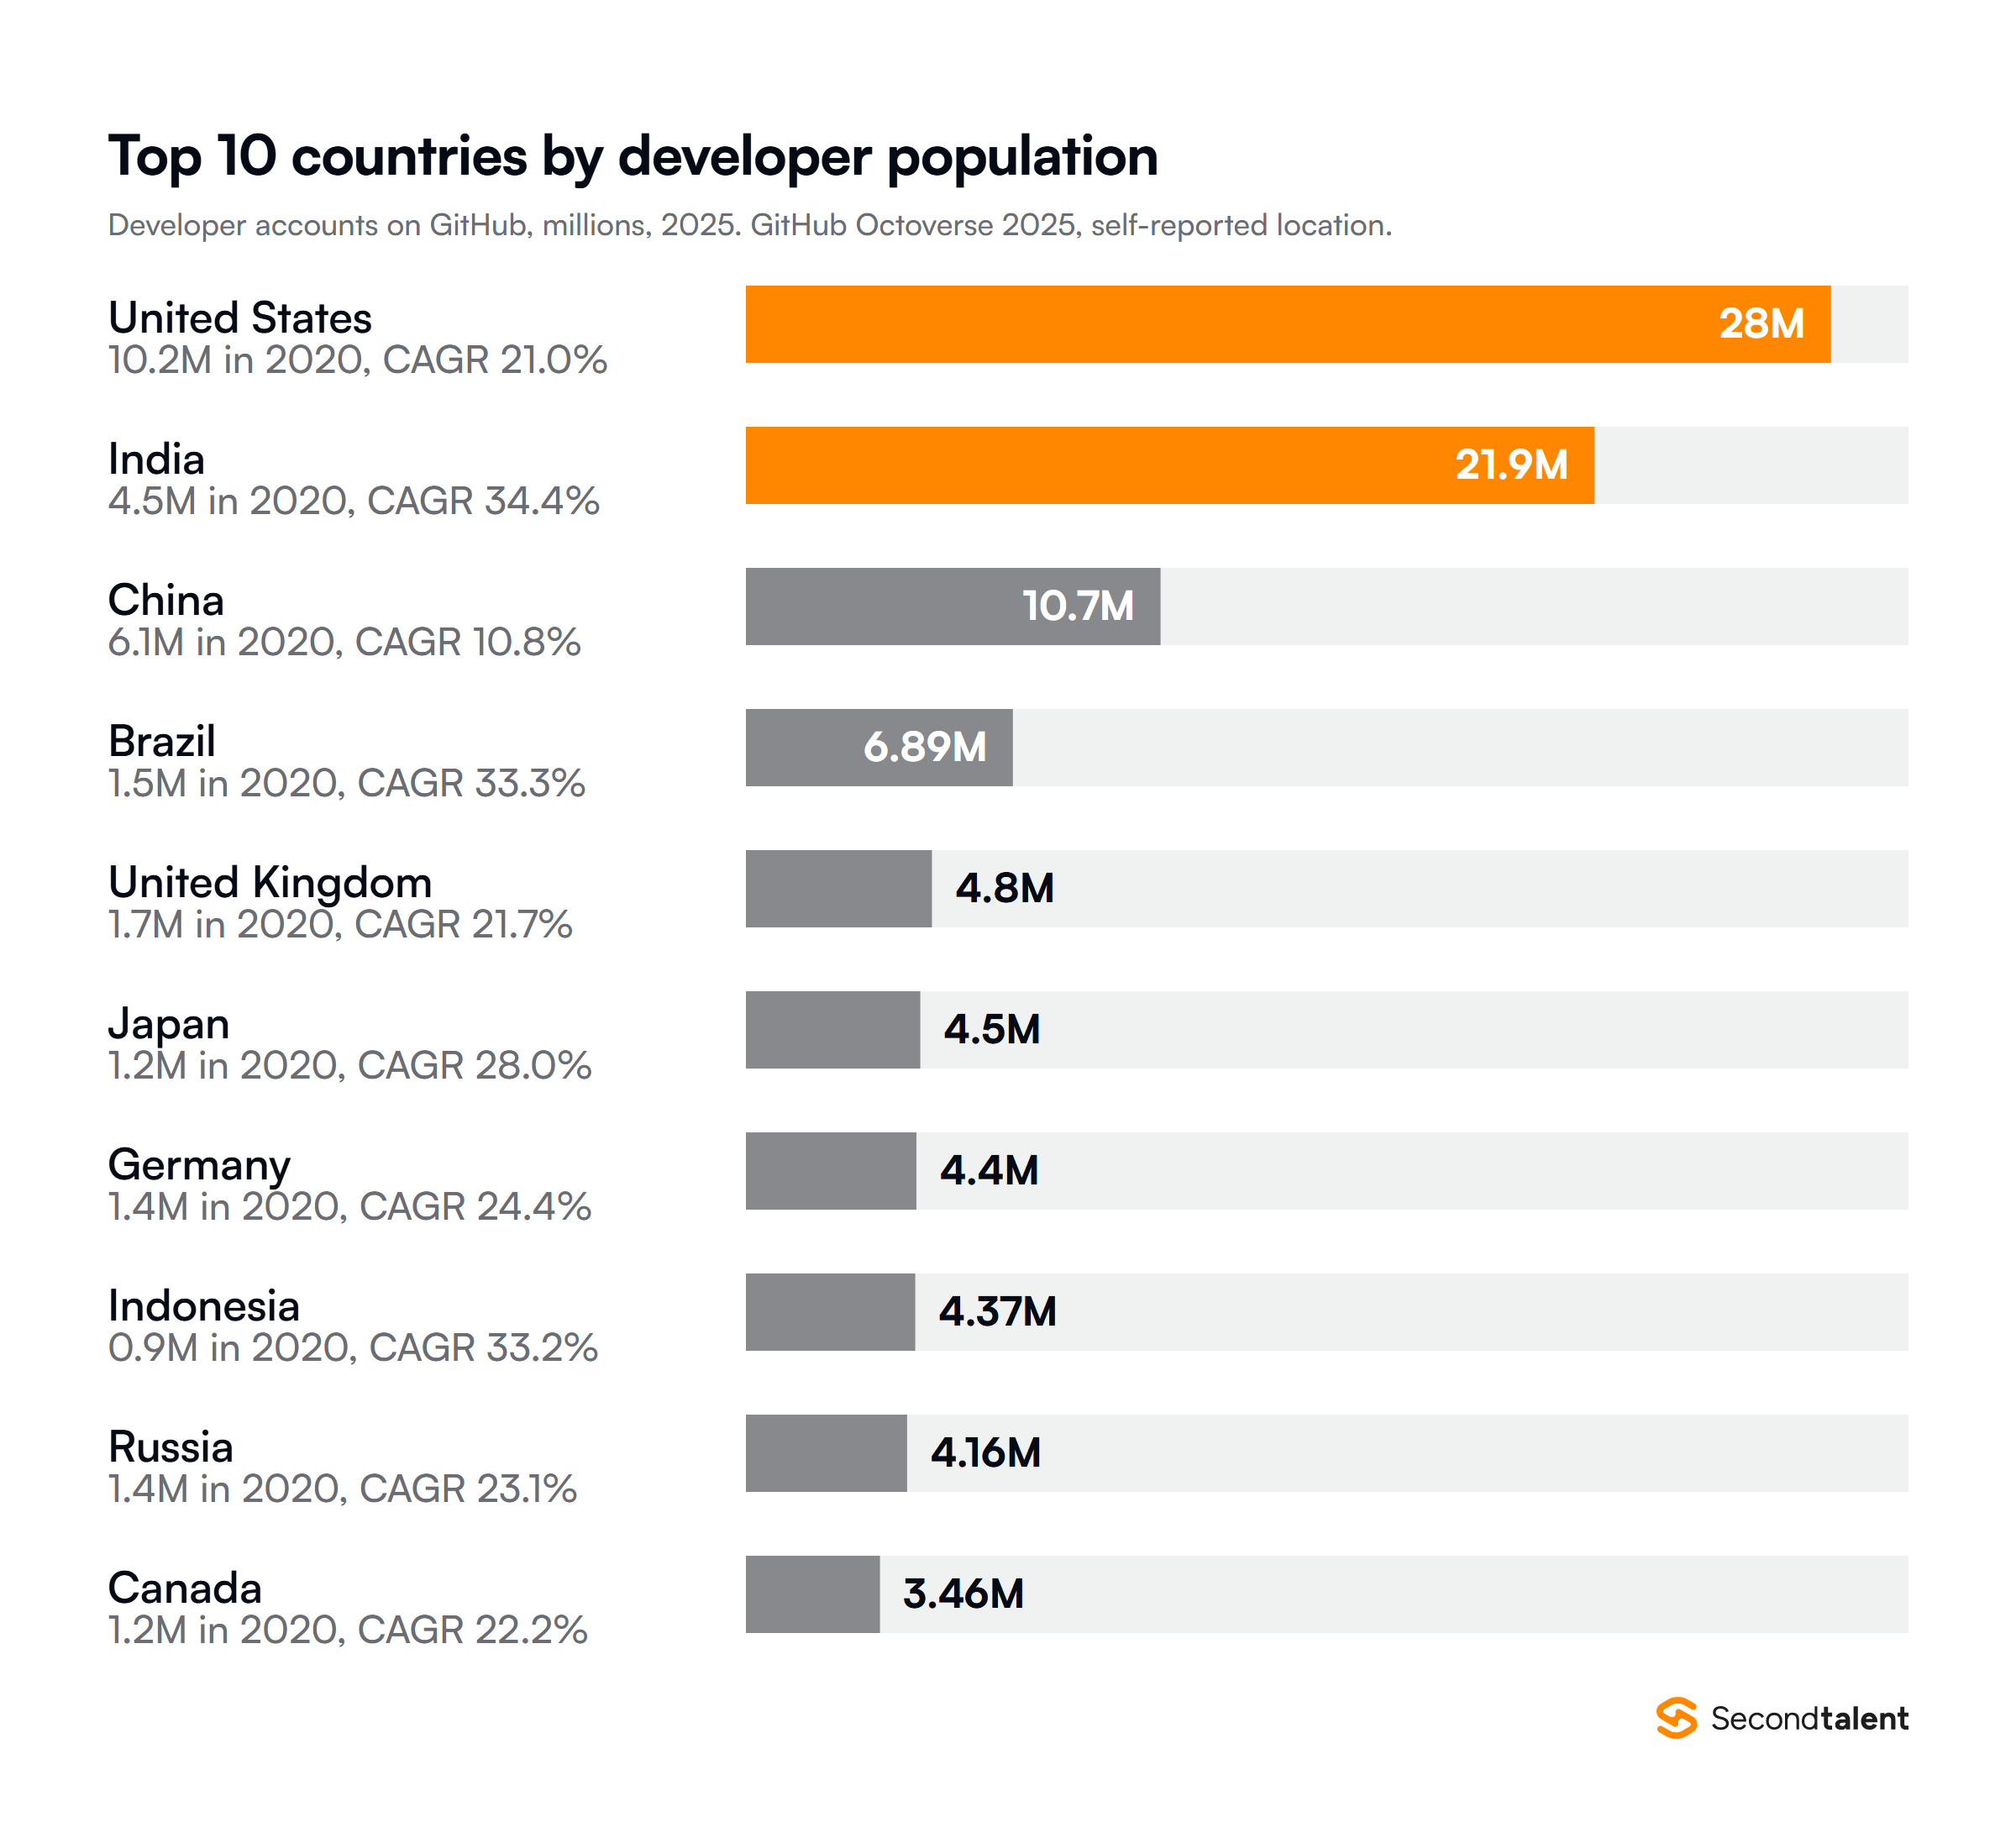
TL;DR: The United States has the most software developers on GitHub, with 28 million accounts in 2025. India is second at 21.9 million and, on GitHub's projection, passes the US by 2030. China, Brazil and the United Kingdom complete the top five.
In 2025, India added more than 5.2 million developer accounts to GitHub, a little over 14% of the 36 million who signed up worldwide. India, Brazil and Indonesia each more than quadrupled their counts between 2020 and 2025.
Those are accounts, not jobs. The US Bureau of Labor Statistics counts 1,905,400 software developer, QA and tester jobs in 2025, against 28 million US accounts on GitHub.
- 1Indonesia jumped three places to eighth, the biggest climb in the top 10, and is the only Southeast Asian country on the list.
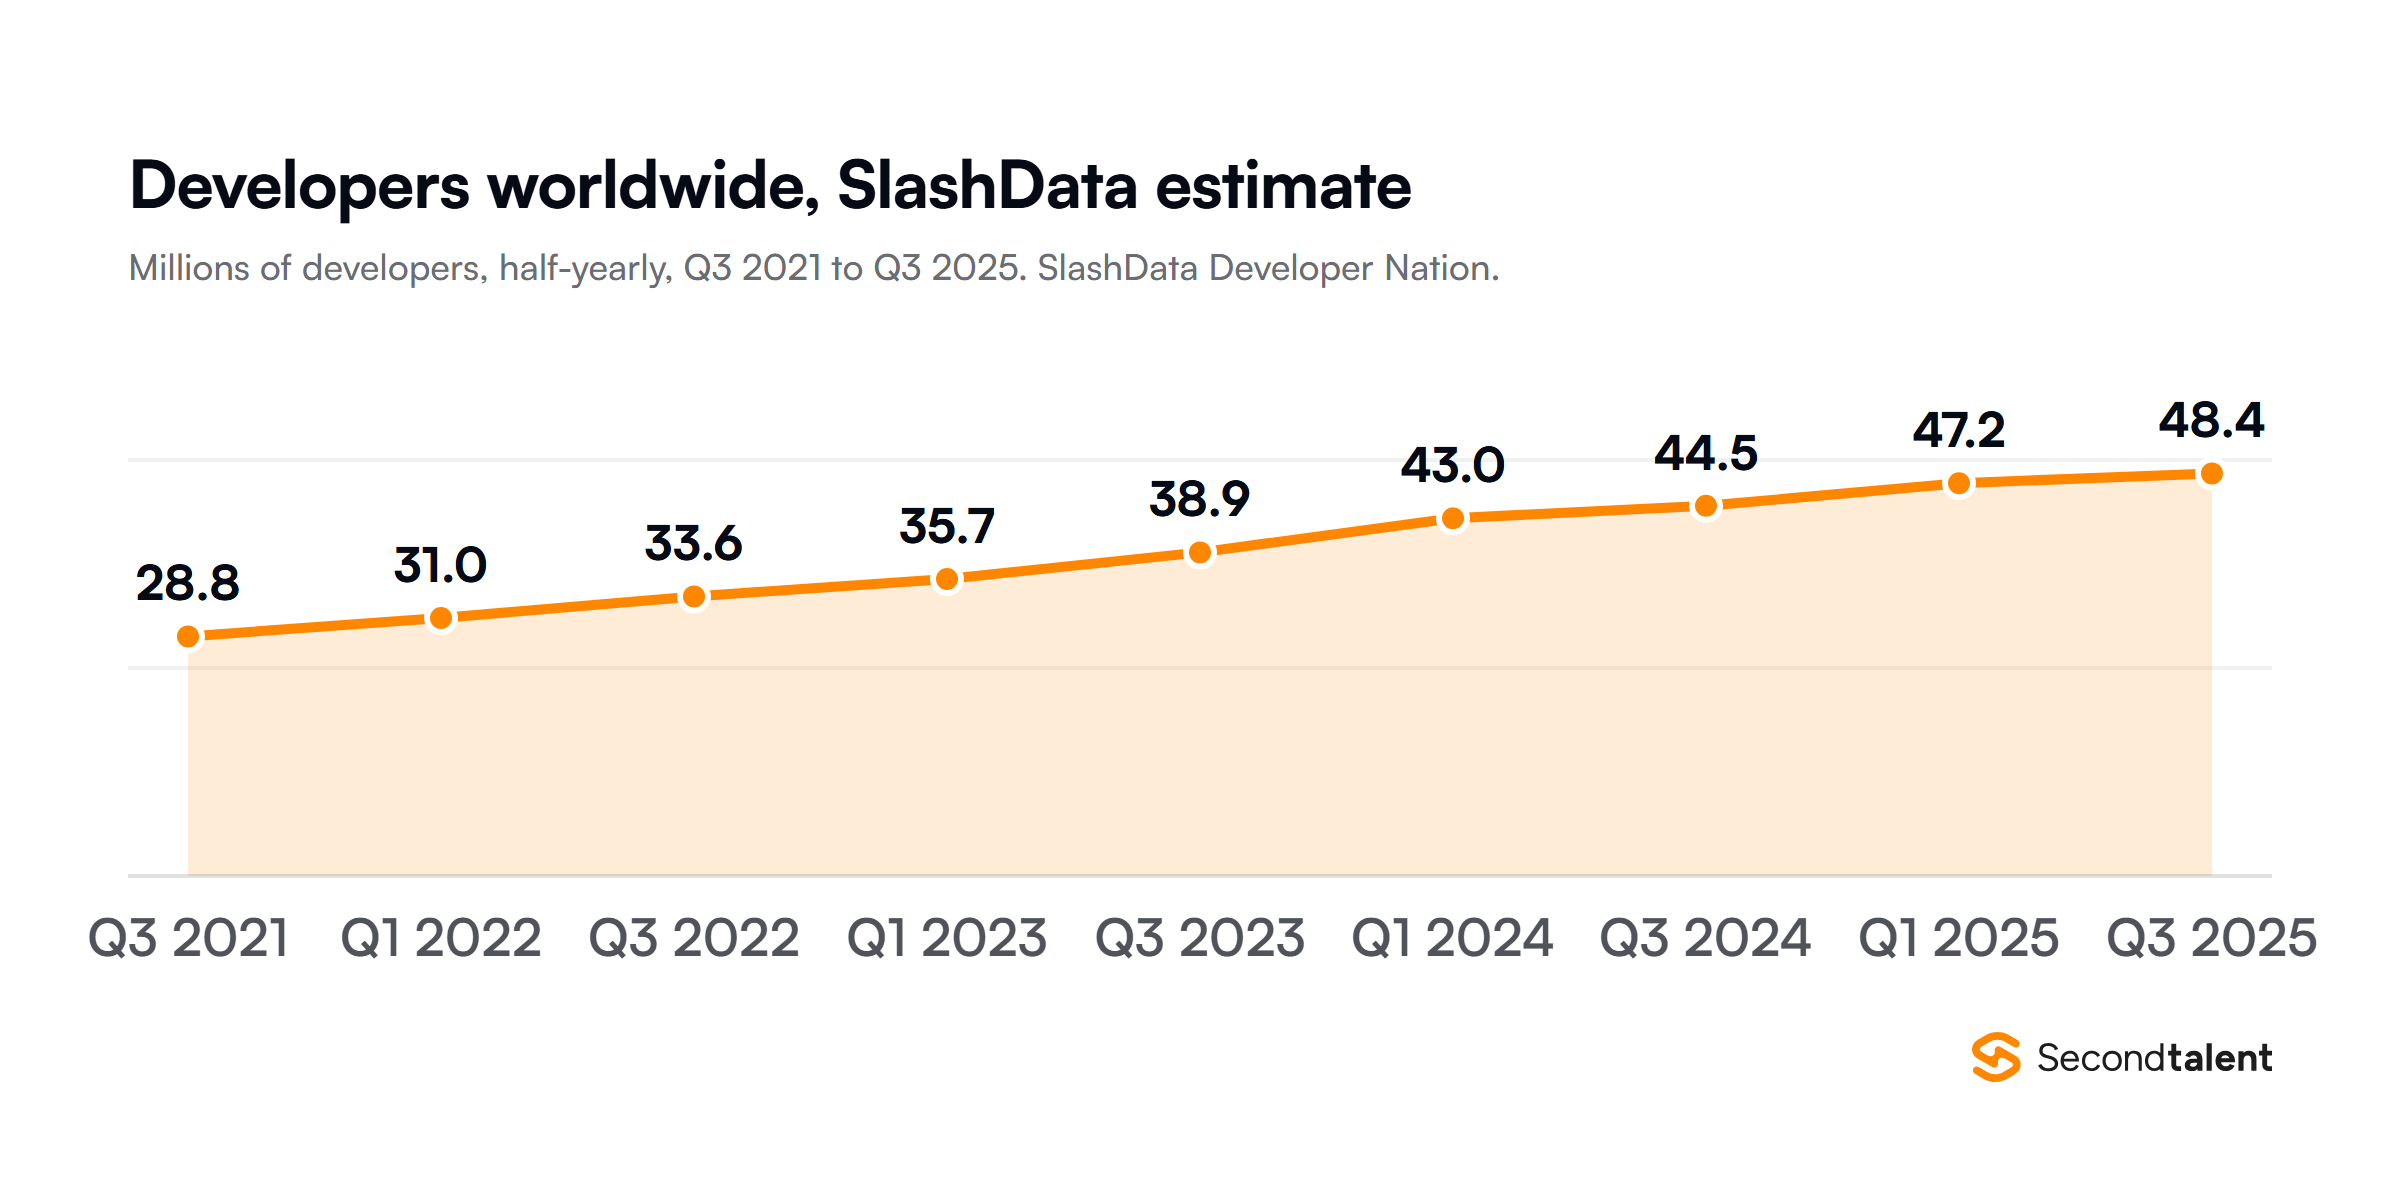
- 2Counted as people rather than accounts, SlashData puts the world at 48.4 million developers, and its growth slowed to 10% in the latest 12 months.
- 3Africa and the Middle East hold seven of the ten fastest-growing developer markets on GitHub.
- 4In Asia-Pacific, Pakistan, Singapore and the Philippines grew their GitHub accounts fastest in the year to Q1 2026.
Top 10 Countries With the Most Software Developers in 2026
The ranking uses GitHub’s Octoverse 2025, which reports developer accounts for each country on one method.
| Rank | Country | Accounts, 2025 | Growth a year, 2020 to 2025 | Projection, 2030 |
|---|---|---|---|---|
| 1 | United States | 28M | 20.96% | 54.7M |
| 2 | India | 21.9M | 34.36% | 57.5M |
| 3 | China | 10.7M | 10.83% | 17.7M |
| 4 | Brazil | 6.89M | 33.27% | 19.6M |
| 5 | United Kingdom | 4.8M | 21.74% | 11.0M |
| 6 | Japan | 4.5M | 27.96% | 11.7M |
| 7 | Germany | 4.4M | 24.43% | 9.8M |
| 8 | Indonesia | 4.37M | 33.23% | 8.7M |
| 9 | Russia | 4.16M | 23.14% | Not in top 10 |
| 10 | Canada | 3.46M | 22.18% | 7.2M |
Nine of the ten more than doubled between 2020 and 2025. China, which went from 6.1 million accounts to 10.7 million, did not.
1. United States
US developers made more contributions to public repositories in 2025 than any other country, even though India now has more contributors. In generative AI repositories alone, the US produced about 12.8 million contributions, 31.8% of the total.
The US had 10.2 million accounts in 2020. GitHub’s Innovation Graph shows 32.4 million US accounts by Q1 2026, up 25.4% in a year by our calculation from its data. The BLS expects software developer, QA and tester jobs to grow 10% from 2025 to 2035, with about 106,100 openings a year.
2. India
India overtook the US in 2025 as the largest base of contributors to public and open source projects. On GitHub’s projection it takes first place by 2030, ahead of the US at 54.7 million.
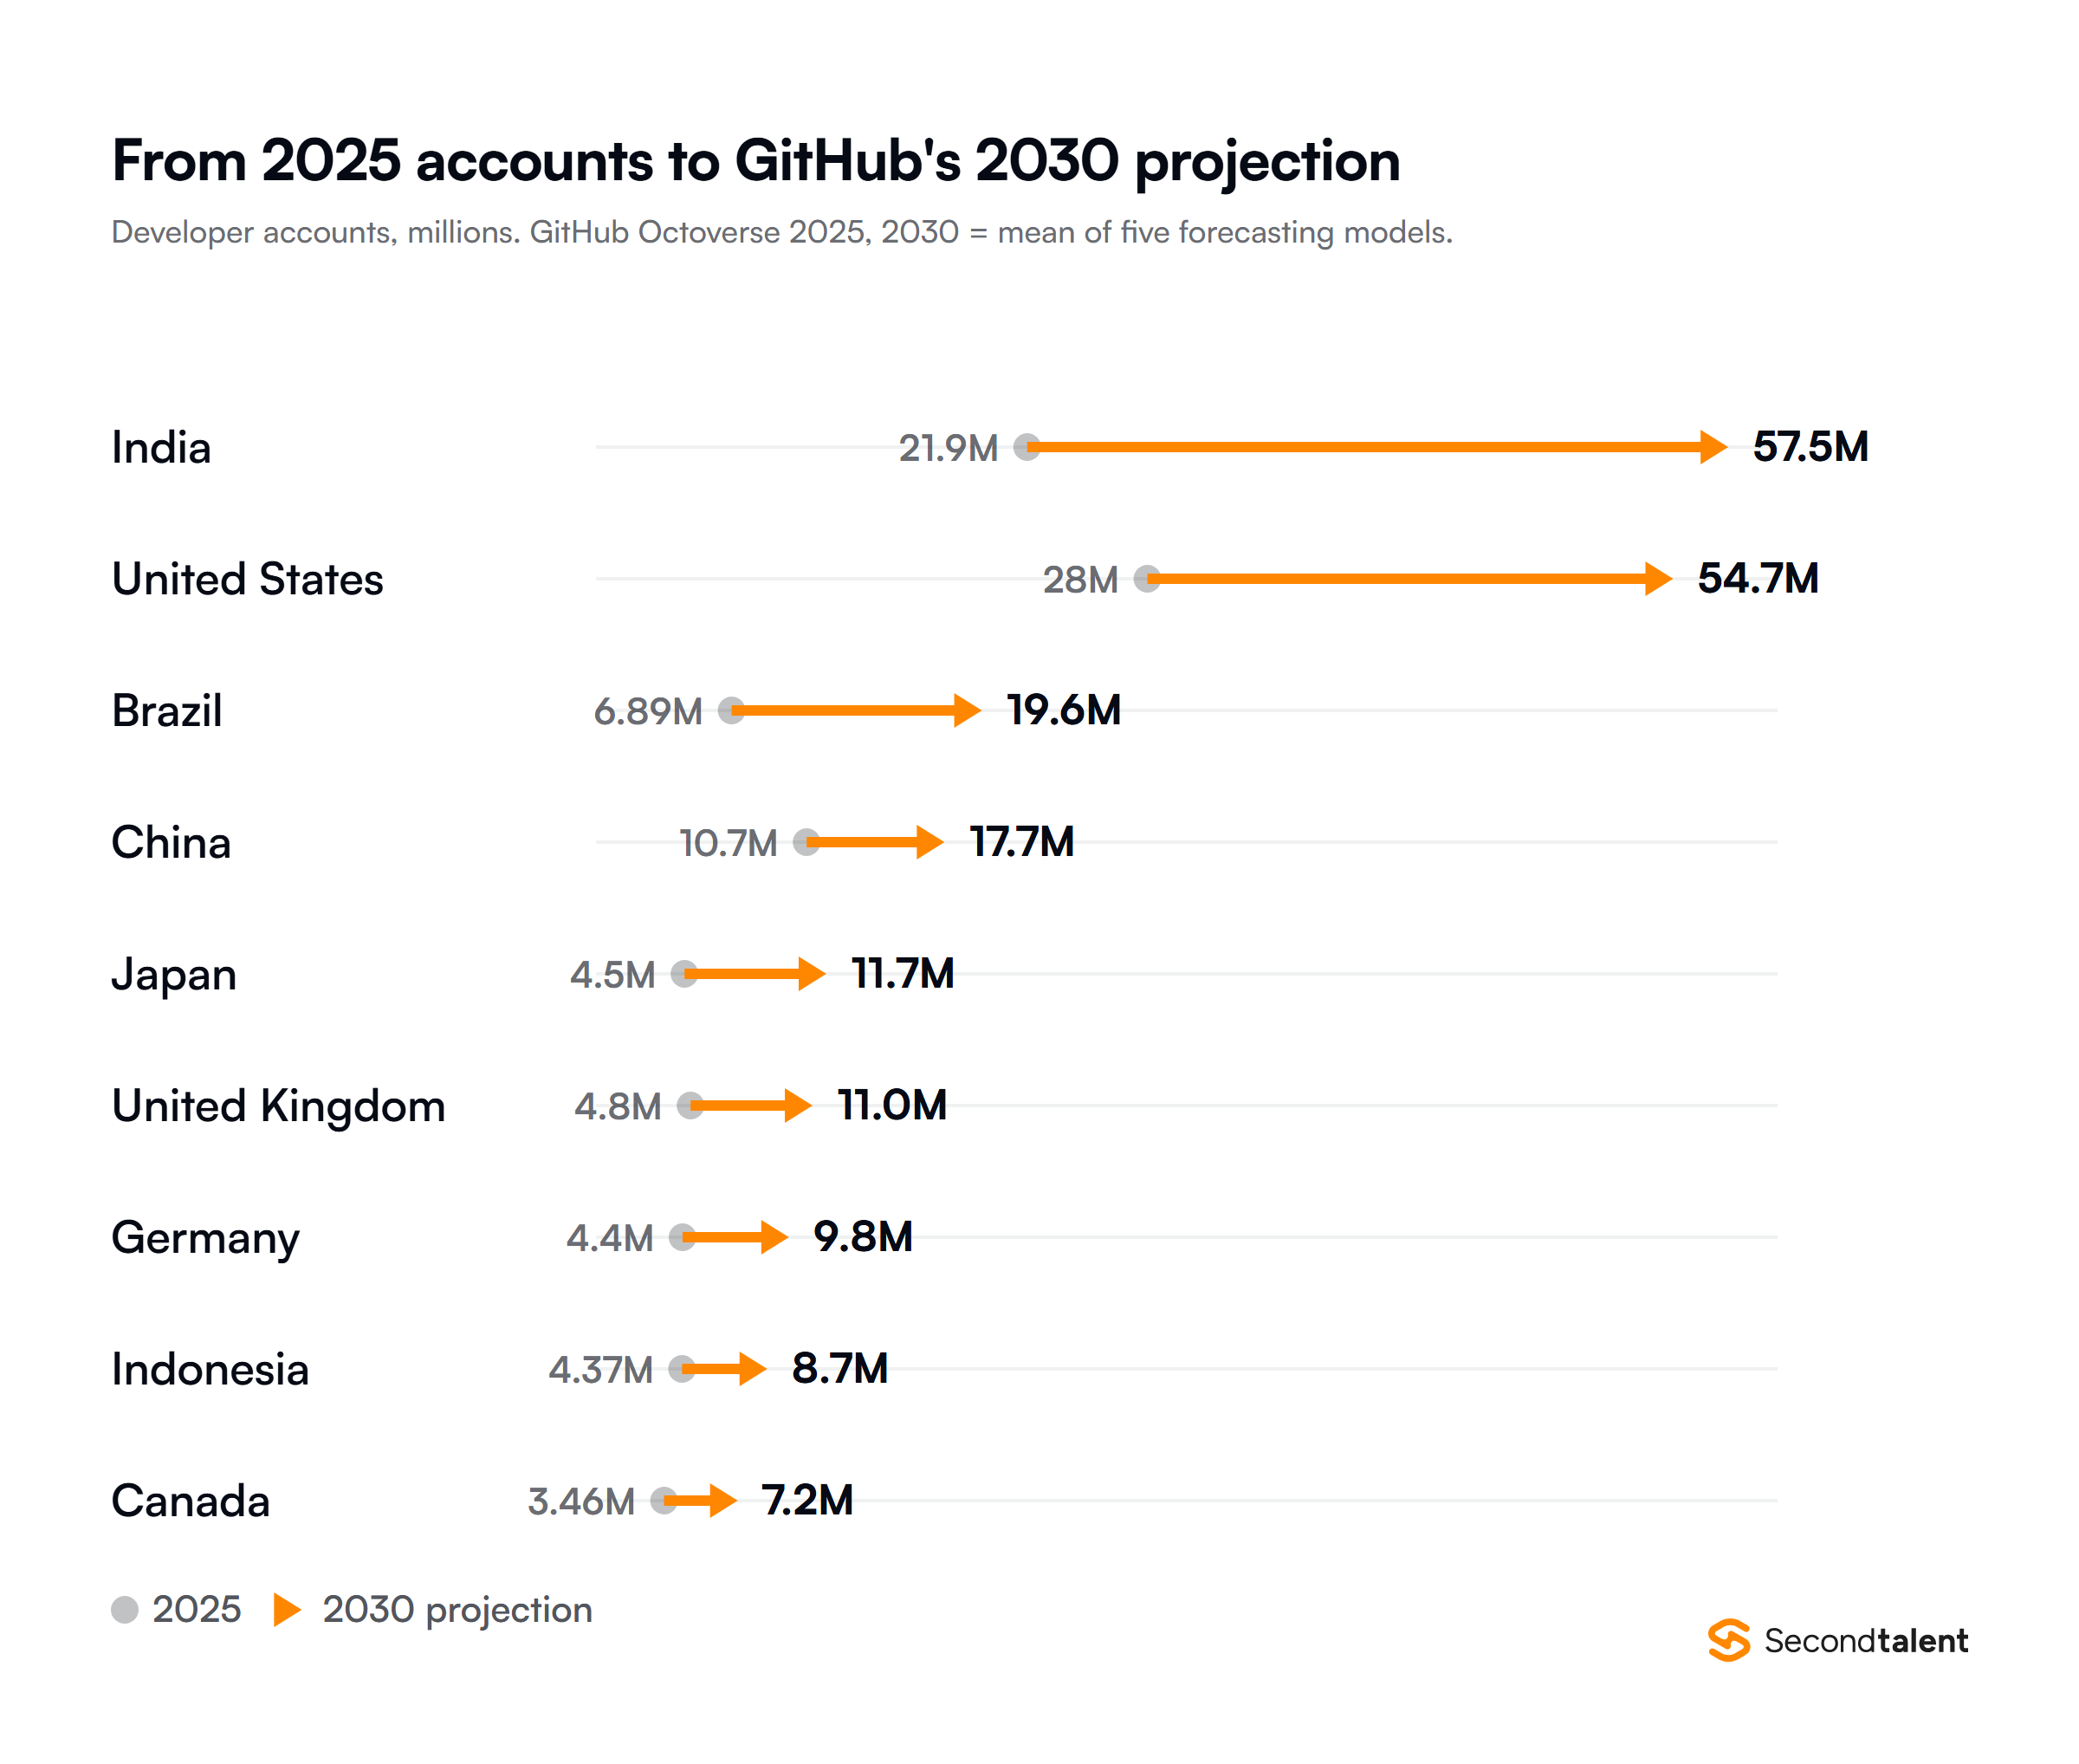
GitHub’s written summary says the US will pass “more than 40 million”, while the chart in the same report shows 54.7 million. Both put the US second.
Most of those Indian accounts are not full-time developer jobs. The NASSCOM Strategic Review 2026 projects direct tech sector employment at about 6 million in FY2026, up 2.3%, and that figure includes business process work. Our developer rates in India page shows what those developers cost by stack.
3. China
China fell from second to third as India passed it, and it is the one country in the top 10 that did not double its count since 2020.
SlashData, which counts people across platforms, estimates Greater China at 5.8 million developers in early 2025, up from 2.4 million in 2022. That is more than double in three years, far faster than China’s GitHub growth. Our reading is that GitHub captures a shrinking share of Chinese developer activity, which makes China the weakest figure in this ranking.
4. Brazil
GitHub ties Brazil’s growth to fintech and open banking investment. The country went from 1.5 million accounts in 2020 to its current count, passing the UK for fourth place, and it already ranks third in the world by open source contributors.
5. United Kingdom
Europe added 6.3 million net new developers between 2024 and 2025, and GitHub names the UK, Germany and France as its standout markets. The UK dropped to fifth when Brazil passed it.
6. Japan
Japan climbed two places to sixth, which GitHub credits to the country’s digital transformation push. It had 1.2 million accounts in 2020, and the Innovation Graph already shows 5.43 million by Q1 2026.
7. Germany
Germany ranks fourth in the world for contributions to public repositories, ahead of Japan and Indonesia, which hold similar account counts. It is fifth by number of contributors, and seventh by accounts after Japan passed it. GitHub projects 9.8 million accounts by 2030.
8. Indonesia
Indonesia grew from 0.9 million accounts in 2020 and joined the global top five by open source contributors in 2025. The Innovation Graph puts it at 5.27 million accounts by Q1 2026, ahead of Germany’s 5.26 million, and GitHub projects 8.7 million by 2030.
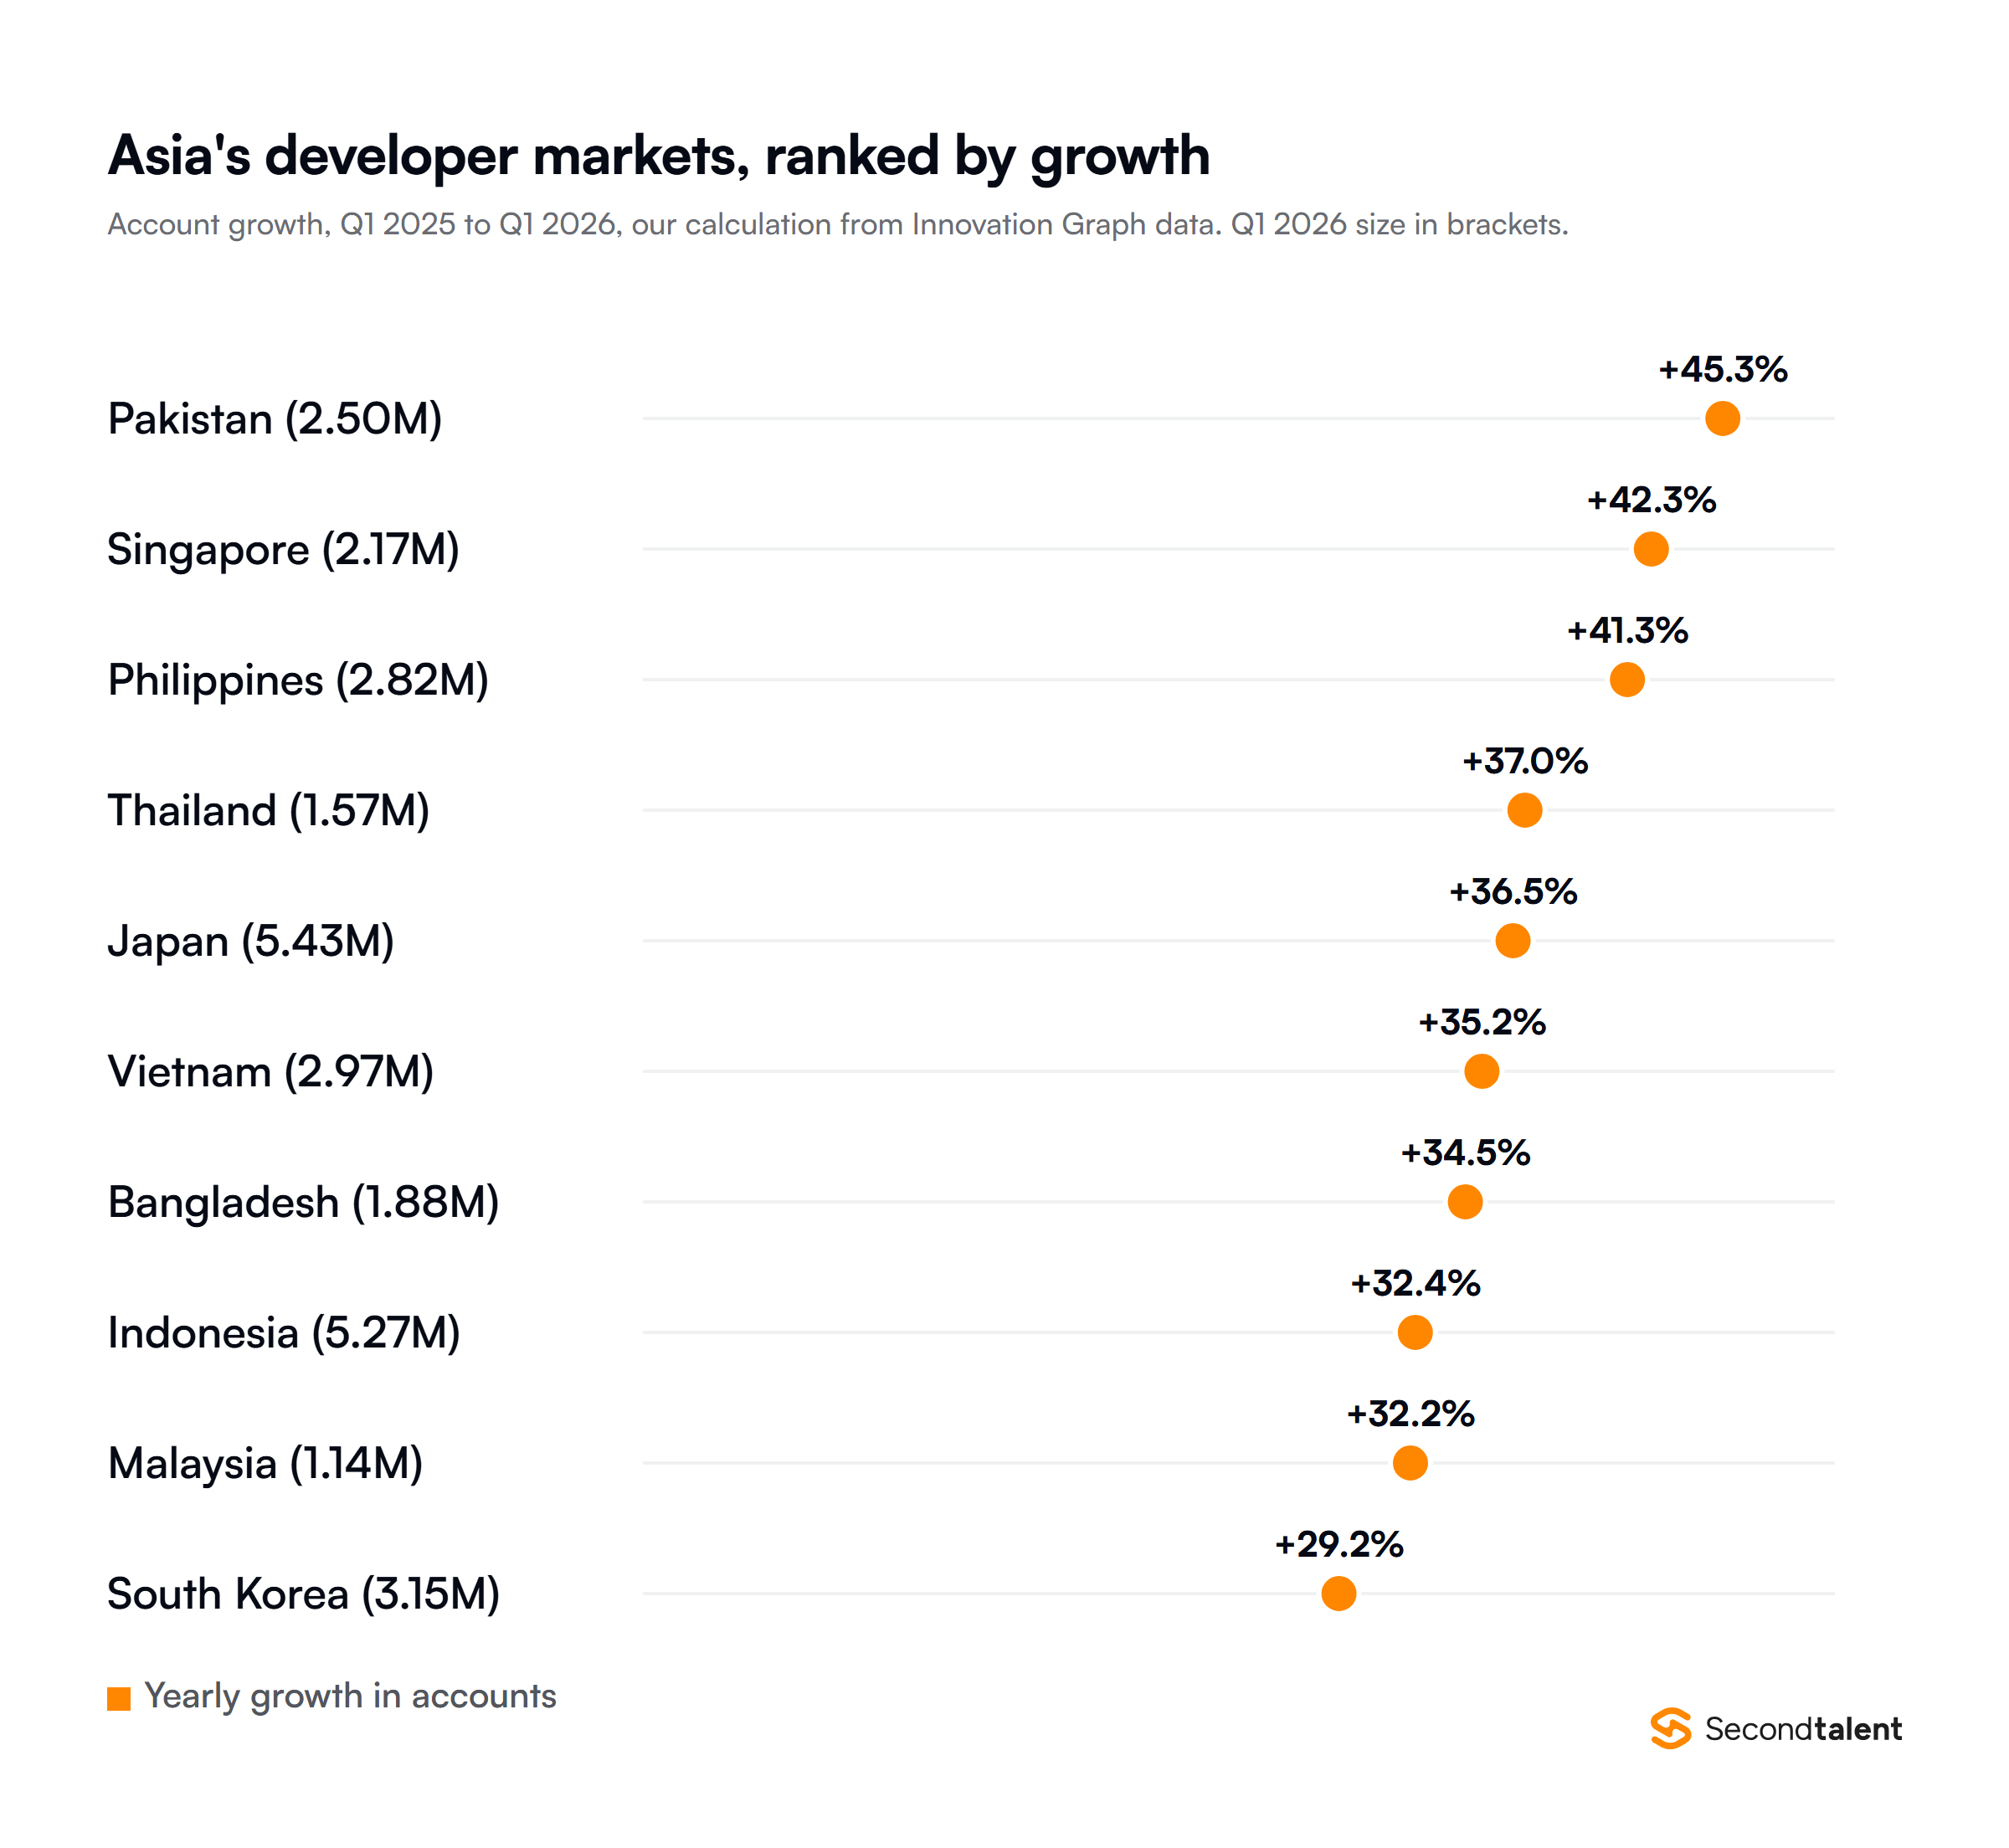
Among the Asian markets in the chart, only Japan has more accounts than Indonesia. South Korea, the next largest, has 3.15 million.
9. Russia
Russia is the only top 10 country missing from GitHub’s 2030 projection, where Egypt takes tenth place at 4.1 million. On the Innovation Graph, Russian accounts grew 16.8% in the year to Q1 2026, the second-slowest rate in the top 10 after China.
10. Canada
Canada’s place is the least secure on the list. Innovation Graph data for Q1 2026 has France at 4.03 million accounts and Canada at 3.99 million, which would drop Canada to eleventh on that tracker.
How Many Software Developers Are There in the World?
About 48.4 million people, according to SlashData’s Q3 2025 estimate, against more than 180 million GitHub accounts. One developer can hold several accounts, and many account holders do not code for pay. The three counts worth knowing measure three different things:
- 180M+ accounts worldwide
- Placed by profile location or IP address; includes students and hobbyists
- 48.4M developers, Q3 2025
- People who write code, modelled from activity data and surveys
- 1,905,400 US jobs, 2025
- Paid software developer, QA analyst and tester roles only
SlashData builds its figure from GitHub and Stack Overflow activity and employment data, calibrated against its Developer Nation surveys of 10,000+ developers a wave.
Growth is slowing: in SlashData’s 2025 population report, the population rose 15% from 2022 to 2023 and 21% from 2023 to 2024, then 10% in the following 12 months.
SlashData publishes regions, not countries. Western Europe and North America are level at about 9.5 million developers each.
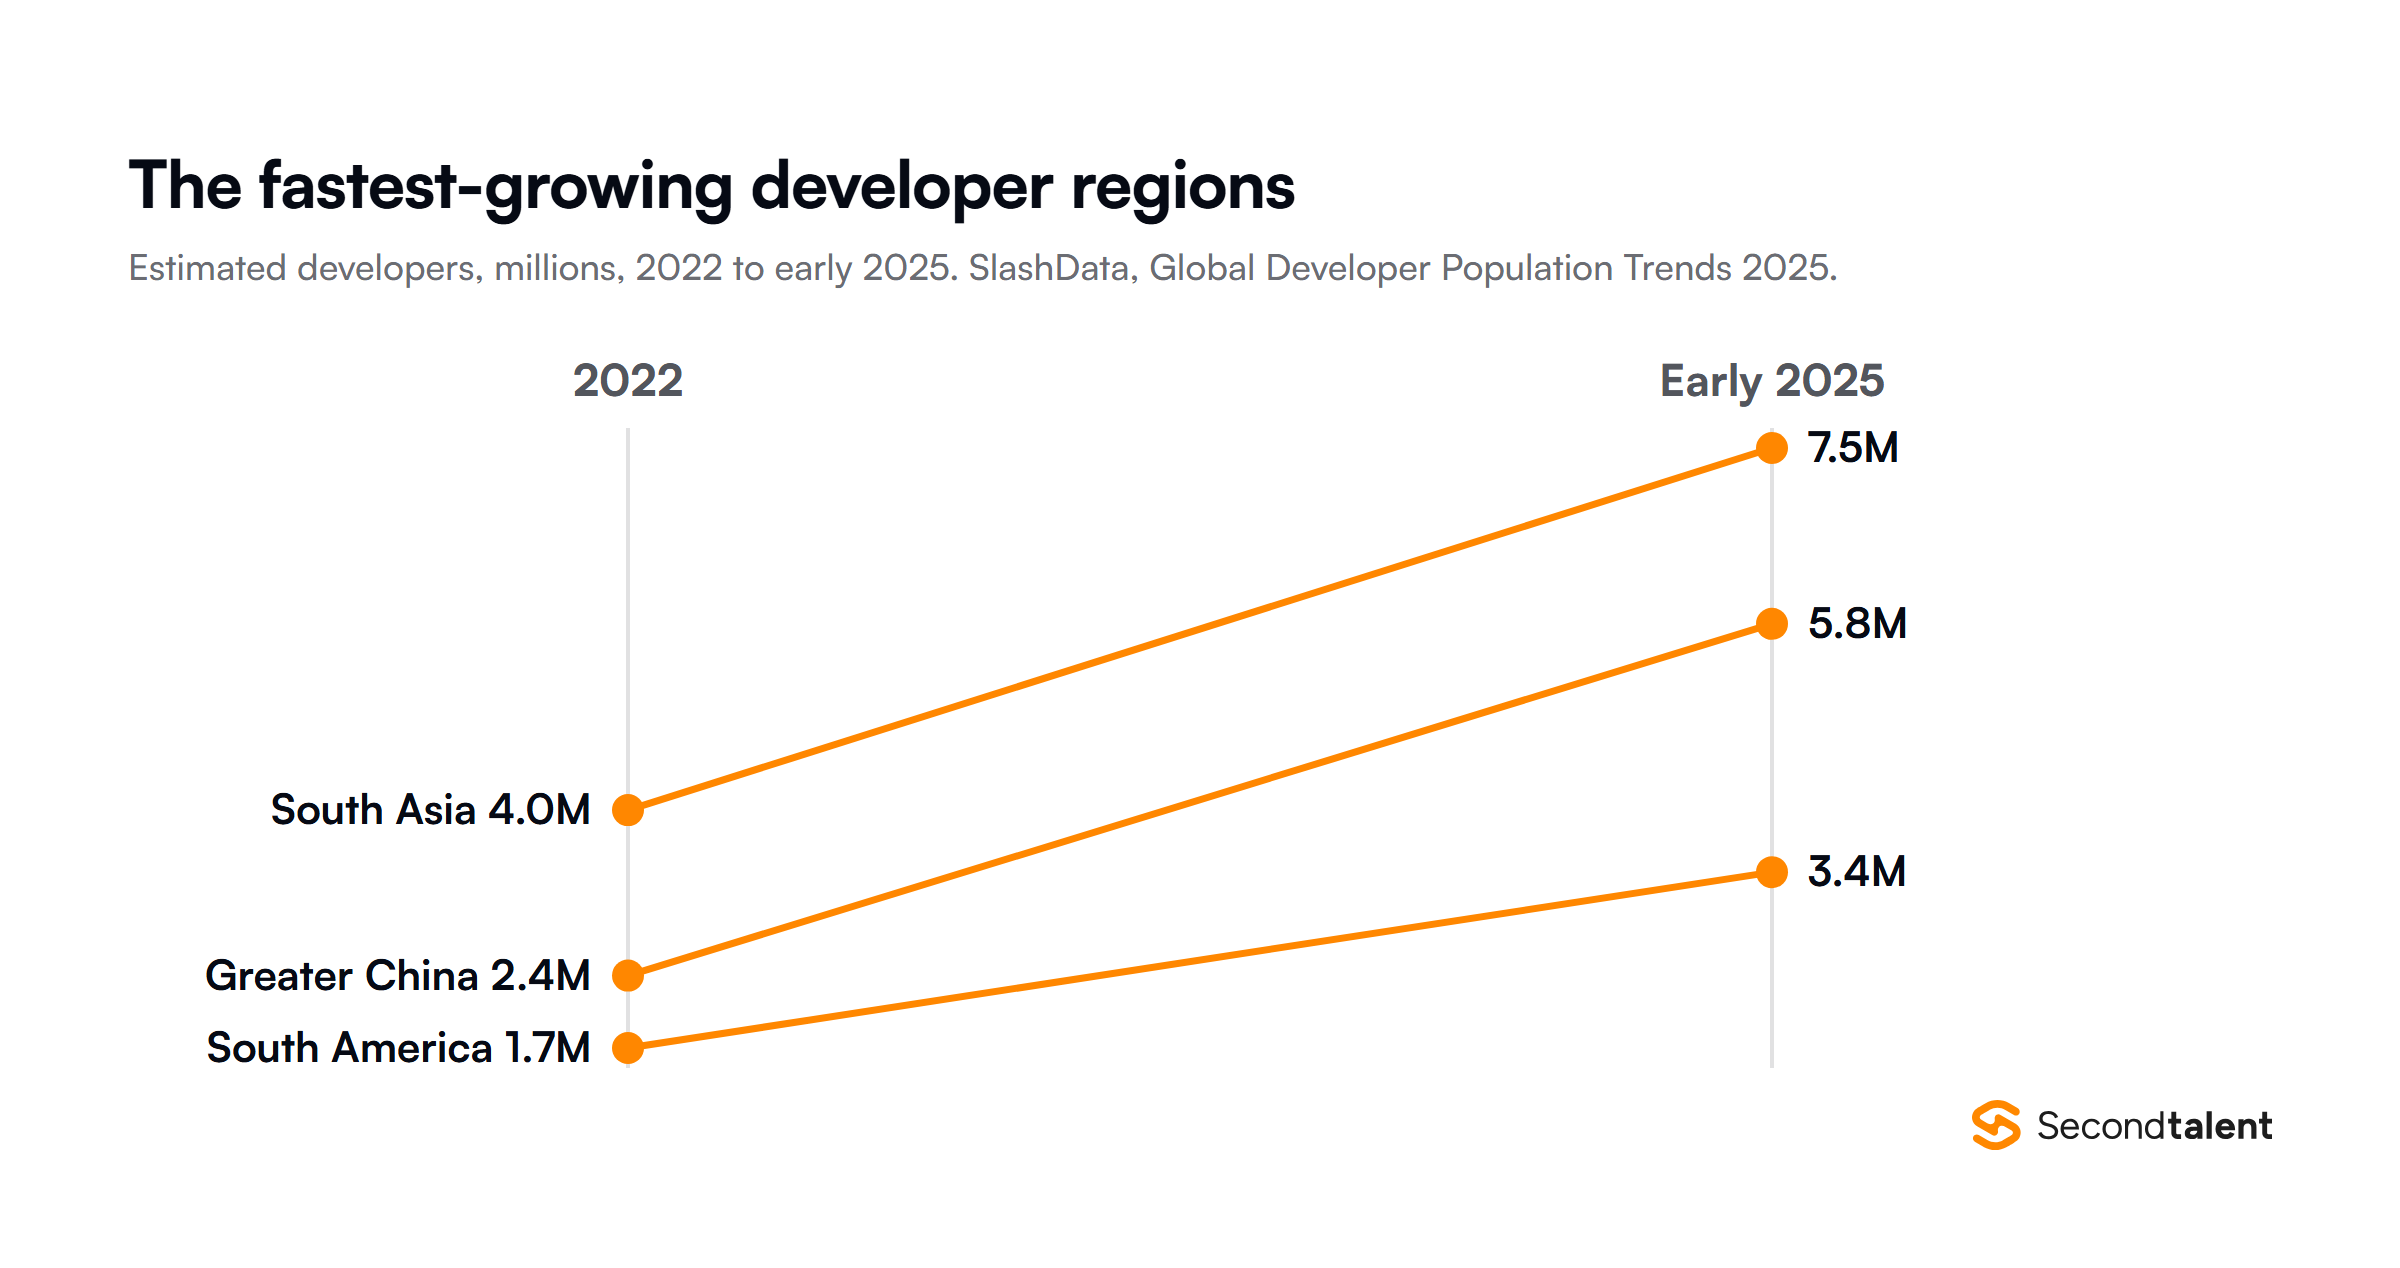
South Asia grew from 4 million developers in 2022 to 7.5 million, and South America doubled from 1.7 million to 3.4 million. Our programming language usage statistics break those developers down by language.
Who the Developers Are: Age and Seniority
The world’s developers are getting older and more professional. SlashData’s 2025 report counts more working developers and fewer hobbyists than three years earlier:
The amateur population fell by more than 1 million in the last year of that period. The 35 to 44 age group rose from 22% to 26% of all developers.
Country markets in Asia skew younger. In the TopDev Vietnam IT Market Report 2024 to 2025, most of Vietnam’s developers are in their twenties, and seniors are a small share:
That profile explains why a large, fast-growing account count does not mean a deep senior bench. Our guides to software development in Vietnam and engineering talent in the Philippines cover each market’s strongest specialisms.
Fastest-Growing Developer Countries
Algeria (+49.1%), Saudi Arabia (+47.2%) and Kenya (+46.3%) grew their GitHub accounts fastest in the year to Q1 2026. The United Arab Emirates, Egypt, Morocco and South Africa follow at 42.8% to 44.6%.
We compared Q1 2026 with Q1 2025 in the Innovation Graph data for each economy with at least 500,000 accounts.
GitHub’s own sign-ups show the same shift. One in three developers who joined in 2025 came from a country outside the 2020 top 10, and GitHub names Egypt, Nigeria, Kenya and Morocco as the African markets set to add millions.
Pakistan (45.3%), Singapore (42.3%) and the Philippines (41.3%) are the only Asia-Pacific economies in that top 10, and the chart in the Indonesia entry ranks all ten Asian markets.
By size, Vietnam ranks 14th on the Innovation Graph with 2.97 million accounts, the Philippines 16th with 2.82 million and Pakistan 19th with 2.50 million. Each has grown more than fivefold since Q1 2020.
Developer counts and AI adoption produce different rankings. Our ranking of countries with the highest AI adoption rates puts Singapore third and Israel sixth, and neither makes the developer top 10.
Hire Developers in Asia’s Fastest-Growing Markets
Account growth shows where next year’s junior bench comes from; rates show what seniors cost now. A mid-level full-stack developer costs $28 to $68 an hour in Vietnam, $22 to $58 in the Philippines and $20 to $52 in India on our rate data.
We place pre-vetted engineers across nine Asian markets and match senior candidates within 24 hours. See how we hire in Vietnam and the Philippines, or tell us the role and we will send vetted profiles.
FAQs
How many software developers are in the US?
About 1.9 million in paid jobs. The BLS counts 1,905,400 software developer, QA analyst and tester jobs in 2025, with a median pay of $134,040.
Which Southeast Asian country has the most developers?
Indonesia, with 4.37 million GitHub accounts in 2025, eighth in the world. Vietnam and the Philippines follow on the Innovation Graph, with 2.97 million and 2.82 million accounts in Q1 2026.
Which African country will have the most developers?
Egypt, on GitHub’s projection. It is the only African country in the 2030 top 10, at 4.1 million accounts, and it grew 43.9% in the year to Q1 2026 by our calculation from Innovation Graph data.


![How to Hire Developers in Asia Remotely. How to Hire Developers in Asia Remotely from the USA [2026], by Second Talent.](https://www.secondtalent.com/wp-content/uploads/2026/09/hire-developers-in-asia-remotely-featured-v2-768x403.jpg)

![Workplace Diversity Statistics. Top 100+ Workplace Diversity Statistics [2026], by Second Talent.](https://www.secondtalent.com/wp-content/uploads/2026/09/workplace-diversity-statistics-featured-v2-768x403.jpg)