
TL;DR: Companies spent $143.4 billion on cloud infrastructure services in the second quarter of 2026, 43% more than a year earlier, Synergy Research Group estimates. Amazon still leads with 28% of that market, ahead of Microsoft and Google. AI workloads are the main reason spending is speeding up.
Google Cloud’s revenue grew 82% in the second quarter of 2026, to $24.8 billion. Oracle’s cloud infrastructure revenue more than doubled in the quarter to August.
At that pace the limit is hardware, not buyers: Microsoft’s finance chief Amy Hood told analysts in July that “customer demand continues to exceed available capacity.”
- 1Nine neocloud companies now rank among the top 40 cloud providers by revenue, on Synergy’s count.
- 2Of the organizations that host generative AI workloads, 66% run at least some of them on Kubernetes, the CNCF’s 2025 survey found.
- 3Flexera’s 2026 respondents estimate 29% of their IaaS and PaaS spend is wasted, the first rise in five years.
- 4The BLS projects US jobs for network and computer systems administrators to fall 4% between 2025 and 2035.
How Big Is the Cloud Market in 2026?
Cloud infrastructure services brought in $500 billion over the 12 months to June 2026, Synergy Research Group reported on July 30.
The yearly growth rate has risen for 11 quarters in a row, and the market doubled in size over those 11 quarters.
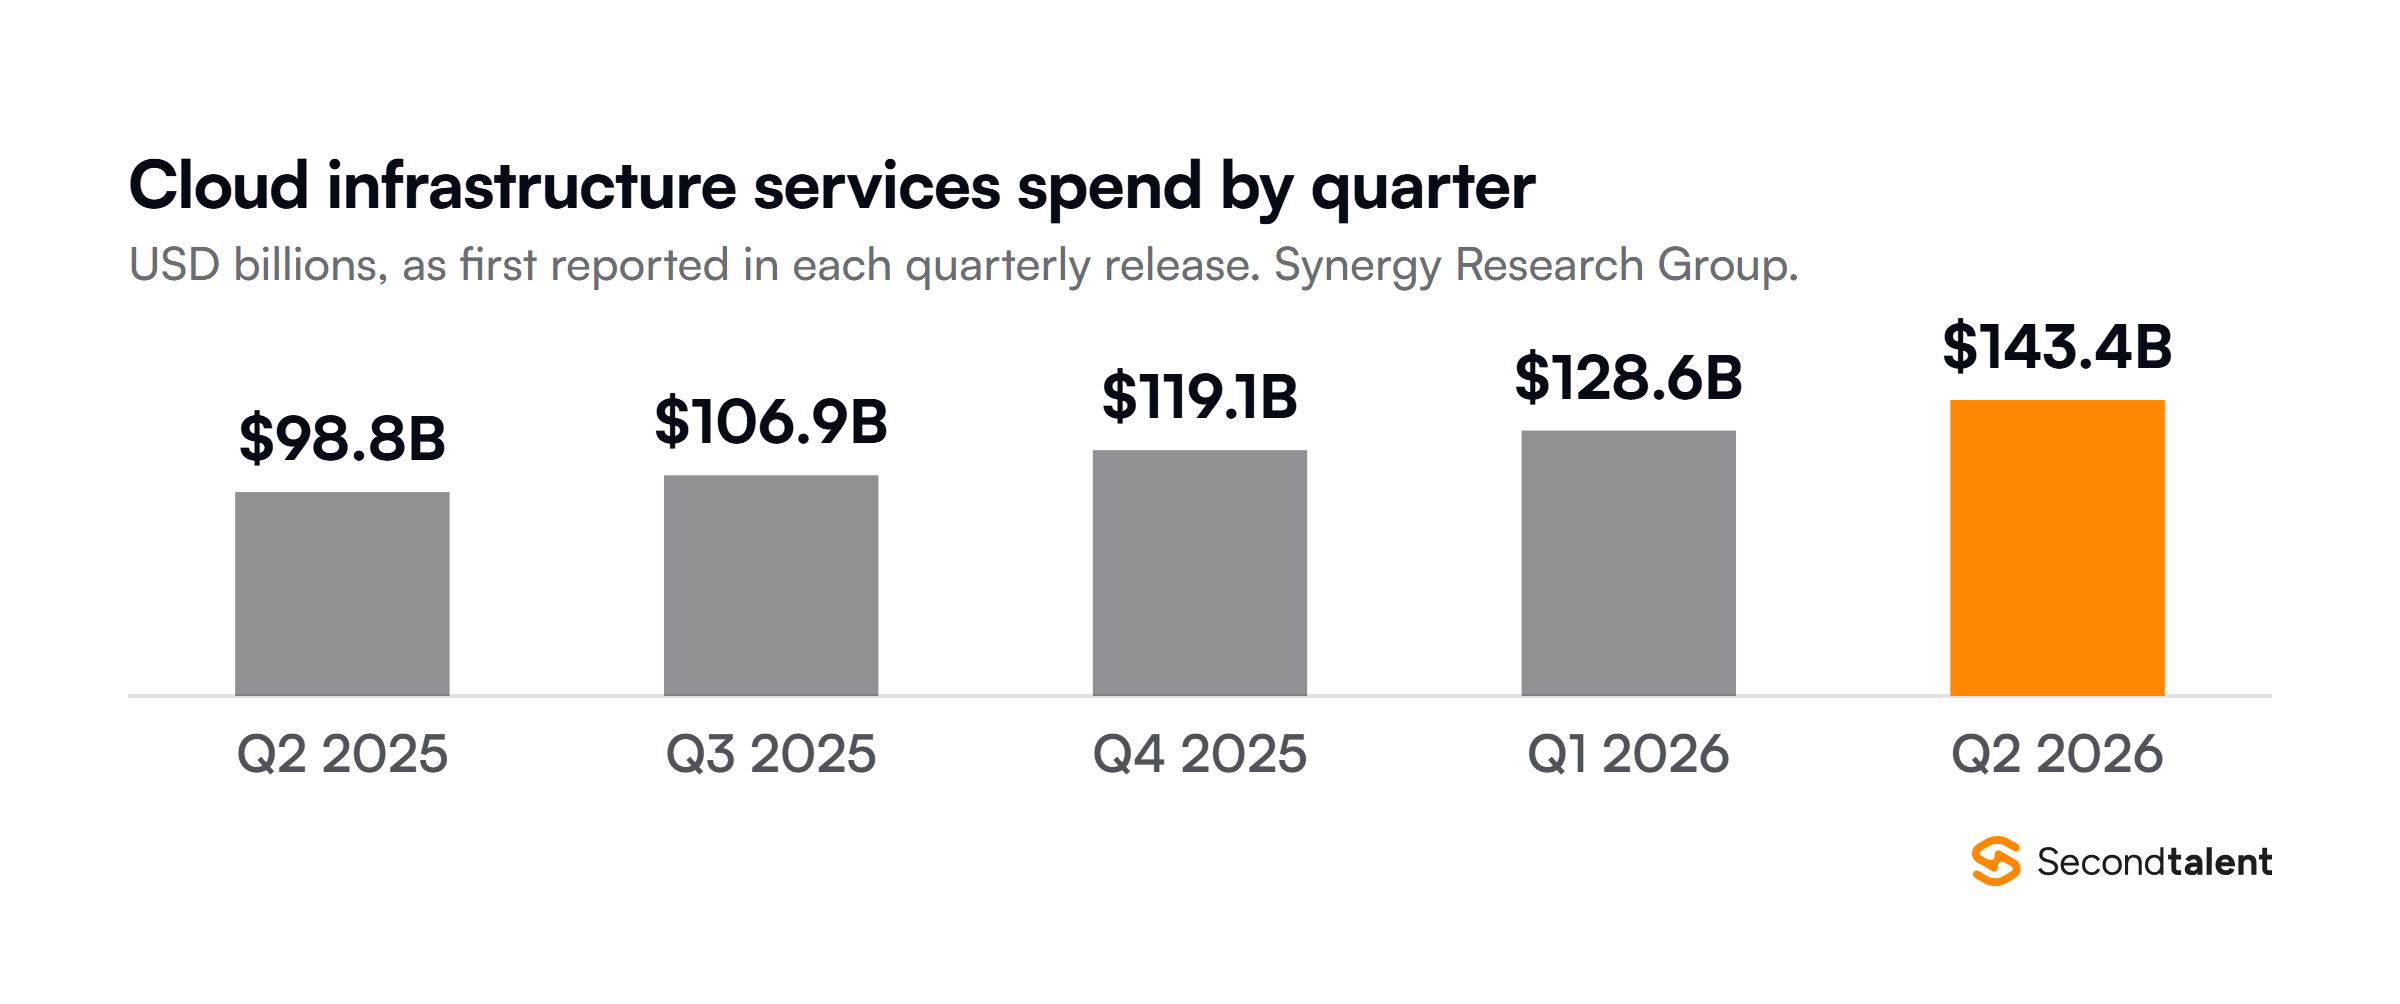
Synergy’s market covers infrastructure as a service (IaaS), platform as a service (PaaS) and hosted private cloud. Public IaaS and PaaS make up most of it and grew 47% in the second quarter.
Services built only for generative AI grew faster still, at 165%.
The US market grew 49%, well above the world average, and is bigger than the whole Asia Pacific region. In local currency terms, India, Indonesia, Ireland, Thailand and Malaysia were the fastest-growing large markets.
Two trackers, two market sizes
Omdia, which absorbed Canalys, runs a rival tracker. Its March 2026 release covers the fourth quarter of 2025, and for that quarter the two firms disagree on both the size of the market and AWS’s share of it.
- $119.1B in the quarter, up 30%
- Amazon 28%, Microsoft 21%, Google 14%
- Counts IaaS, PaaS and hosted private cloud
- $110.9B in the quarter, up 29%
- AWS 32%, Azure 22%, Google Cloud 12%
- Counts bare metal, IaaS, PaaS, containers and serverless
Omdia’s definition does not list hosted private cloud, which Synergy includes. Omdia’s release also forecasts 27% growth in cloud infrastructure services spending for 2026 as a whole.
Public cloud passes $1 trillion
Forecasts that include software as a service (SaaS) run much higher. IDC forecasts public cloud services spending above $1 trillion in 2026, up 21%, and expects it to double by 2029.
SaaS is more than half of that total, but PaaS grows fastest, at 37%.
Gartner’s July IT spending forecast names data center systems and IaaS as the two fastest-growing parts of a $6.37 trillion IT market. In India, Gartner expects IaaS to grow 40% in 2026.
For businesses that need more control over their infrastructure, VPS hosting can provide dedicated resources and a flexible environment for running cloud-based applications and workloads.
“Building the compute capacity required for AI is the largest infrastructure project ever attempted by humanity.”
John-David Lovelock, Distinguished VP Analyst at Gartner, July 27, 2026
Which Cloud Providers Have the Largest Market Share?
Amazon has lost two points of share in a year while Google gained two. In Synergy’s Q2 2025 release the split was 30%, 20% and 13%. A year later it was 28%, 20% and 15%, in a quarter when AWS sales grew at their fastest rate in 18 quarters.
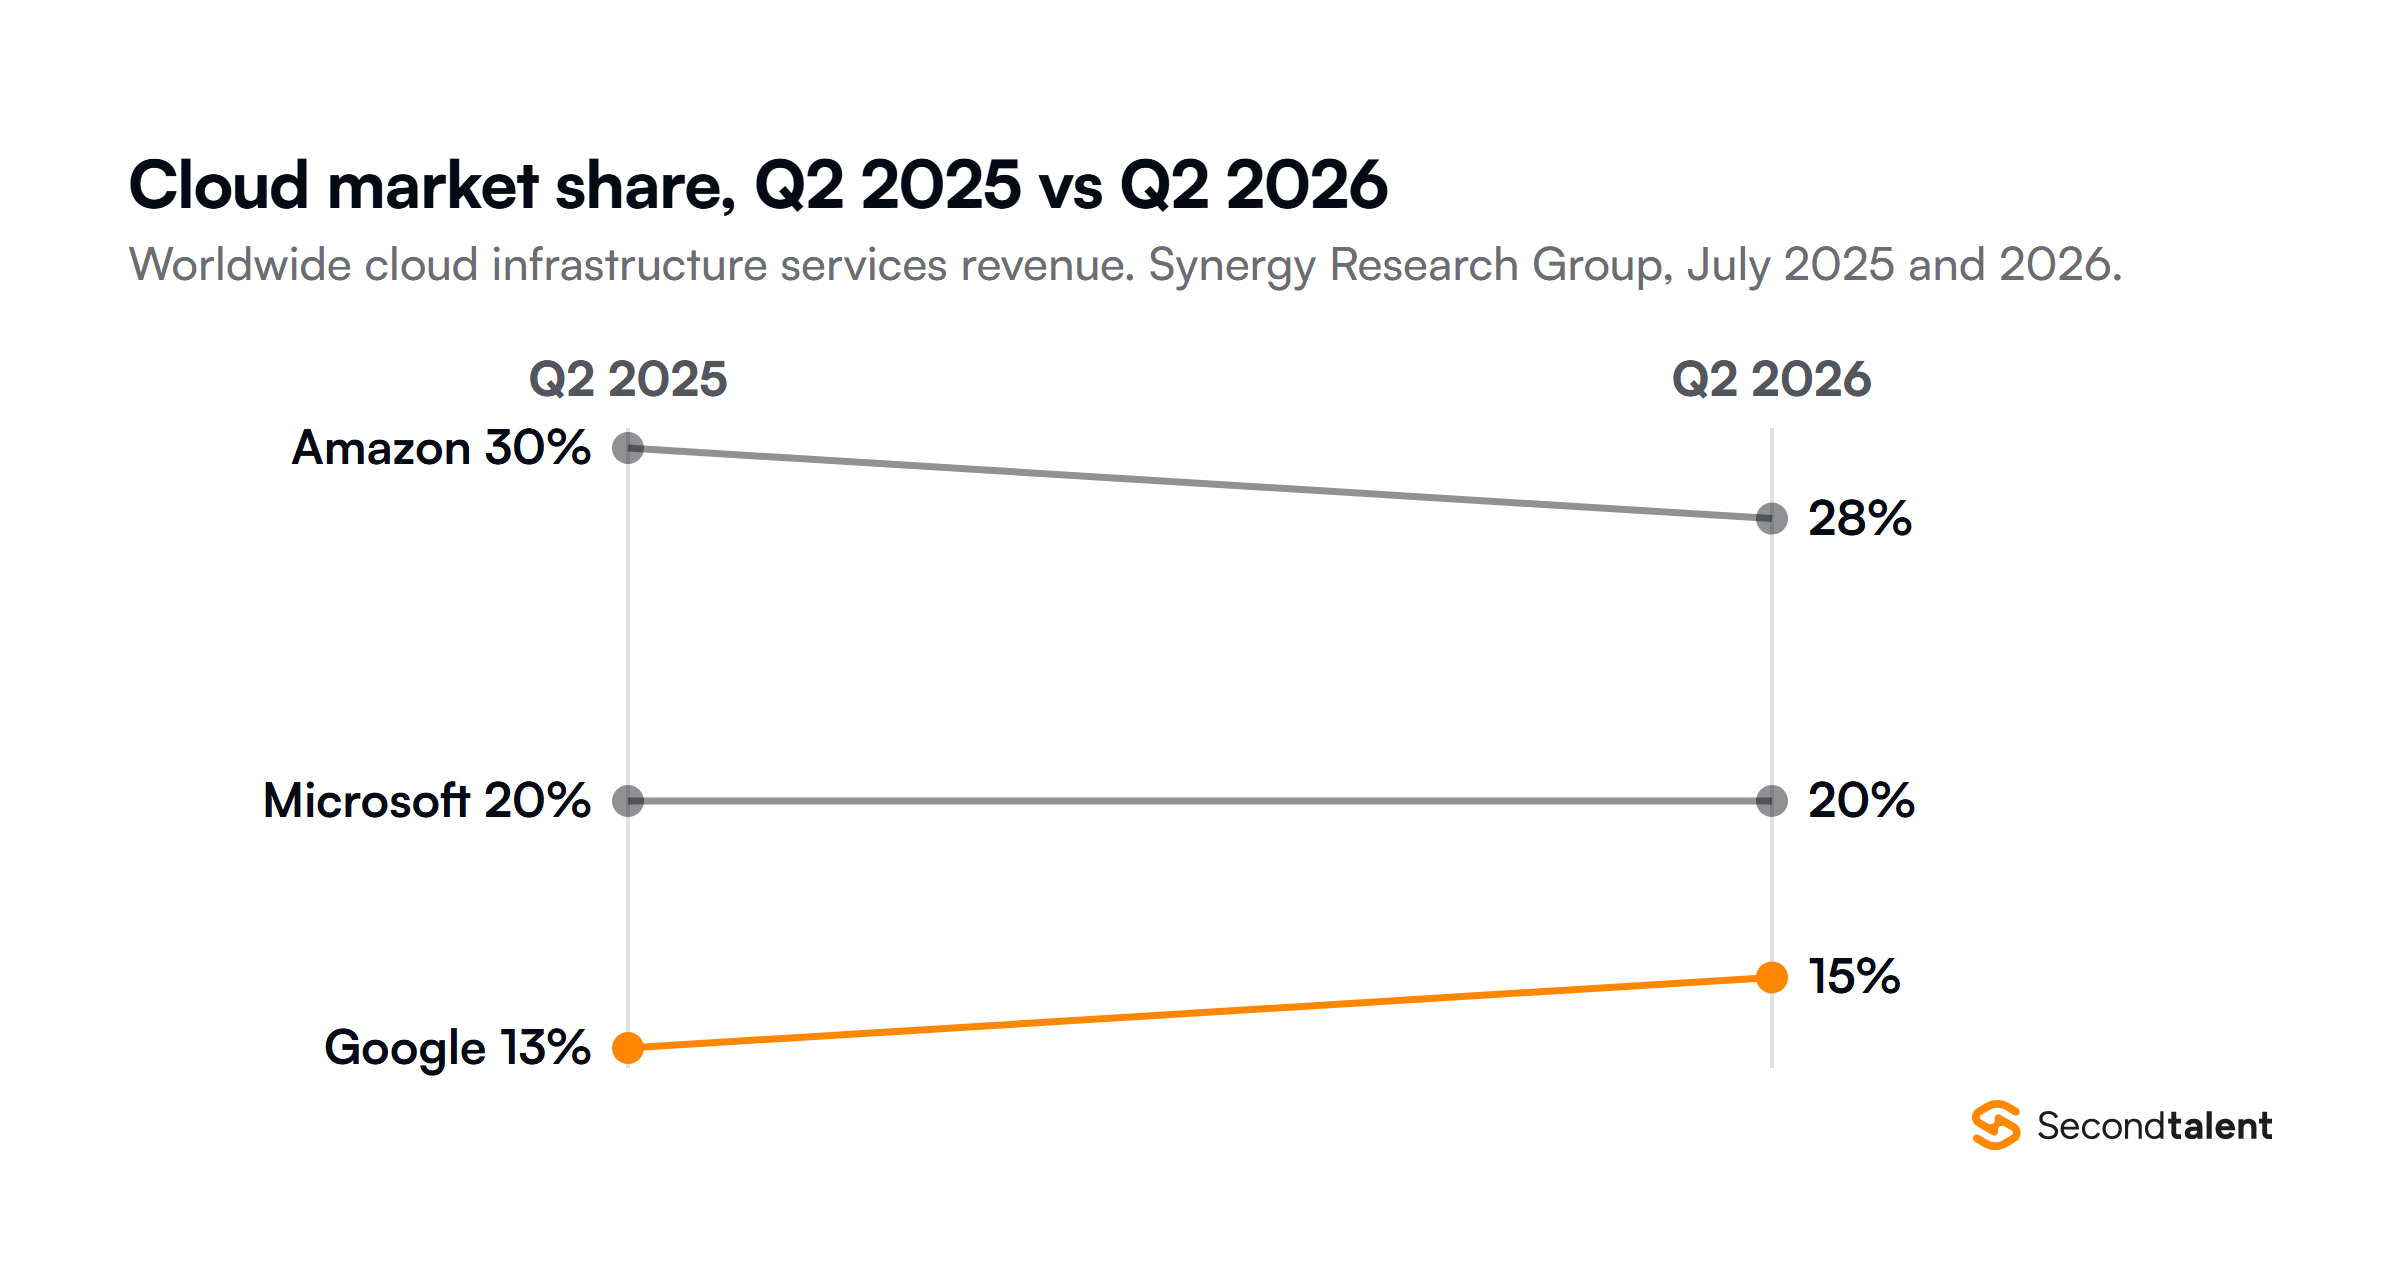
The big three still hold 67% of the public IaaS and PaaS segment. Below them, Synergy names CoreWeave, OpenAI, Oracle, Crusoe, Nebius, Anthropic and Nscale as the fastest-growing providers below the top three.
Neoclouds sell GPU-focused cloud services for AI. In Synergy’s Q1 2026 release, five of them ranked in the top 30 providers. By Q2 there were nine in the top 40.
CoreWeave alone was already earning more than $1.5 billion a quarter at the end of 2025.
Market share and customer counts tell different stories. In Flexera’s 2026 survey, 83% of respondents run some or significant workloads on AWS and 79% on Azure.
Among small and midsize businesses the gap widens, to 77% on AWS against 63% on Azure. Our AWS statistics cover Amazon’s cloud in detail.
How Fast Are Azure, Google Cloud, Oracle and AWS Growing?
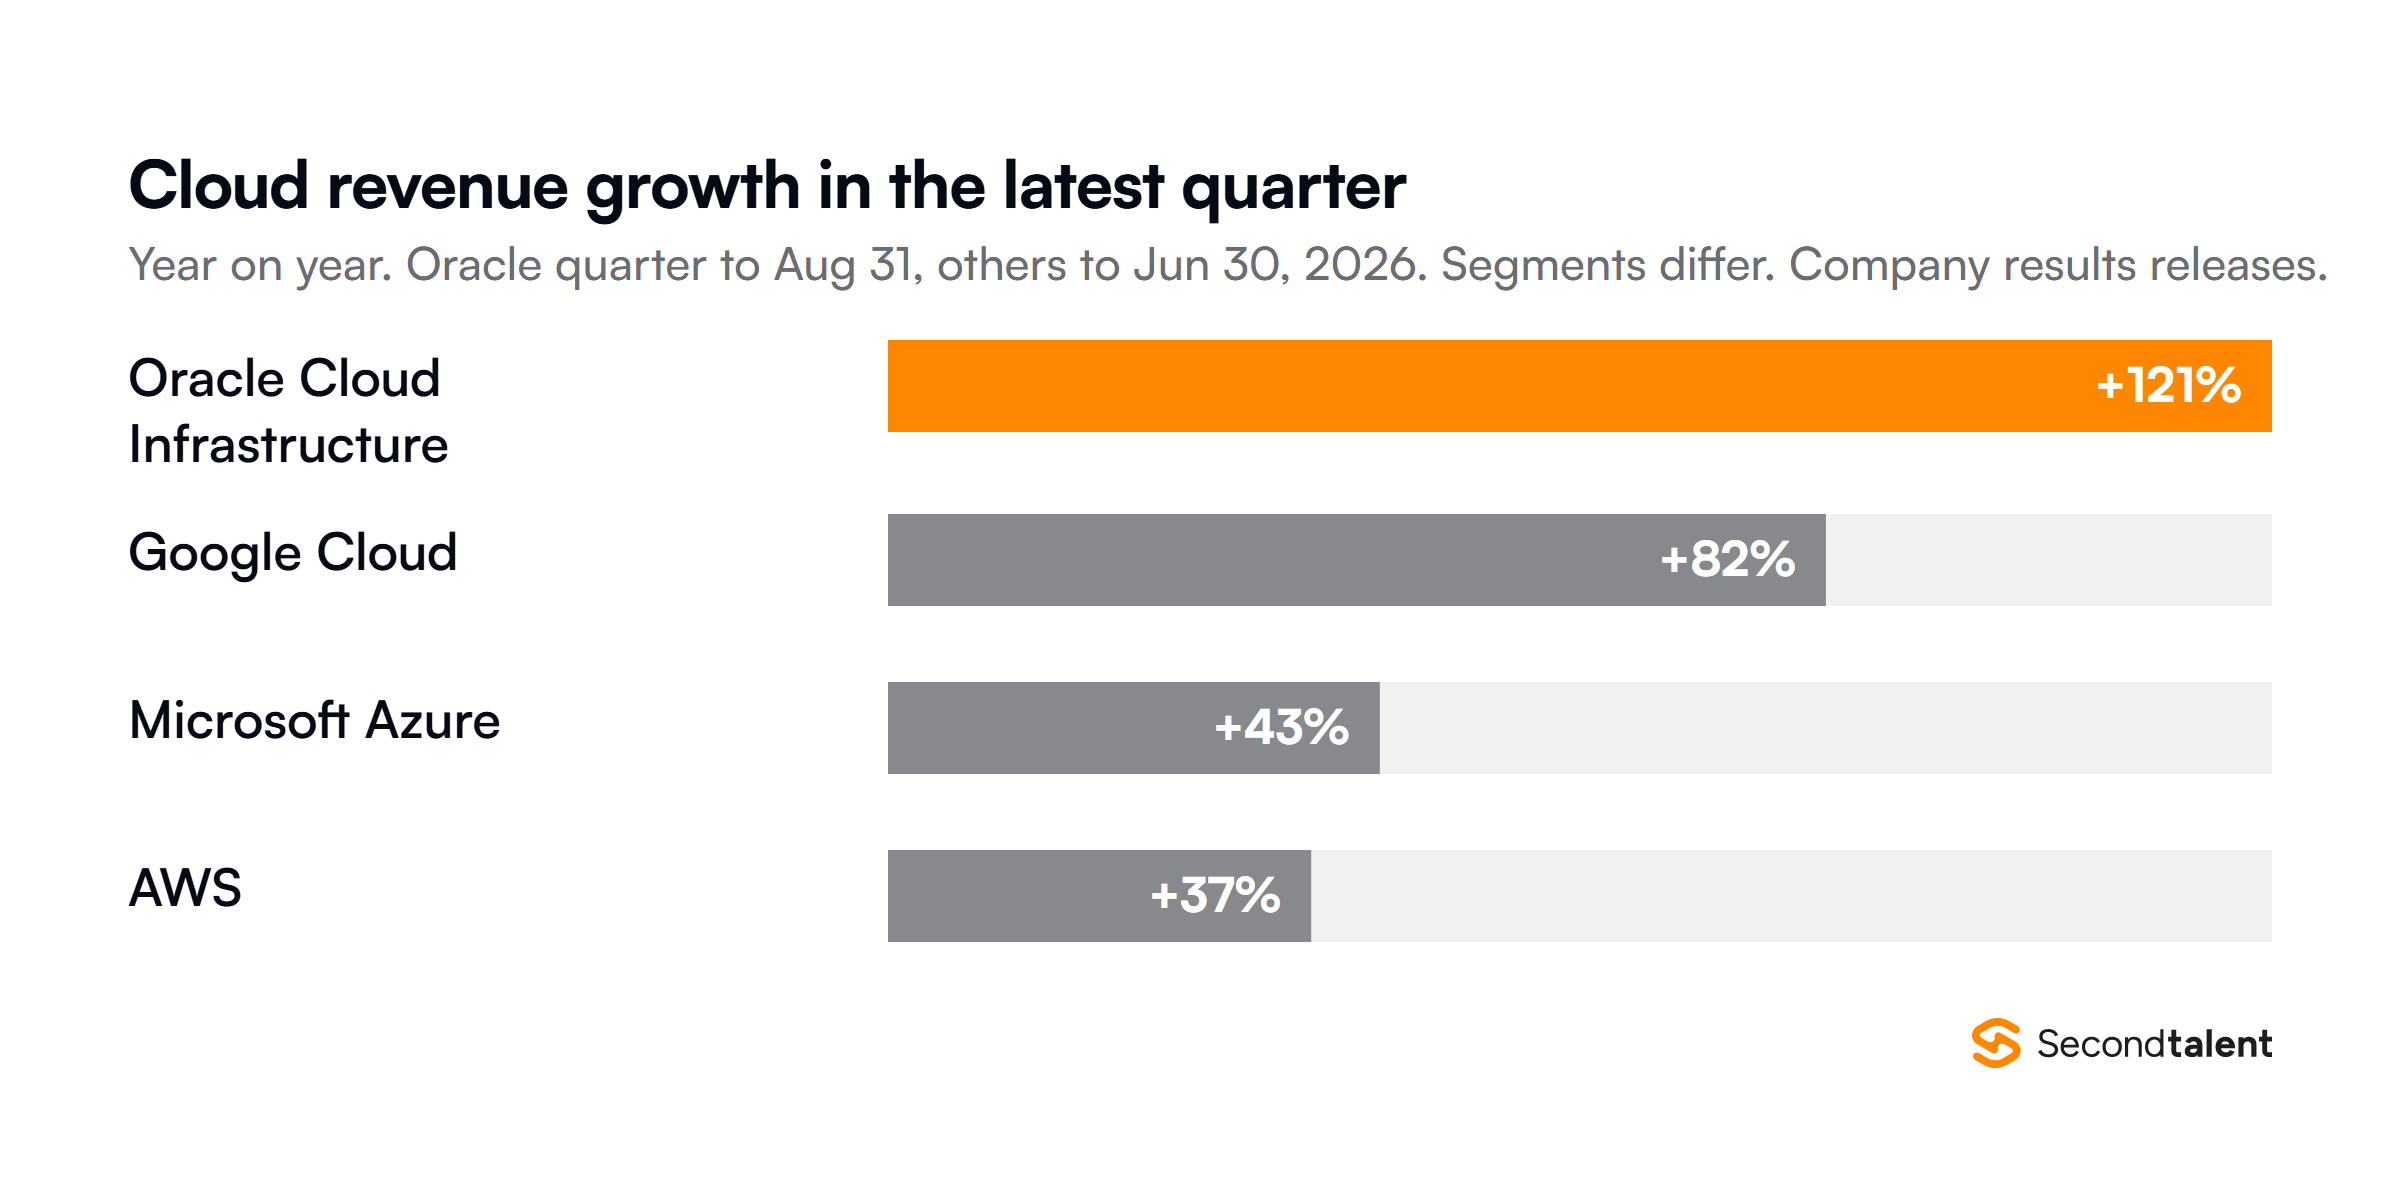
Oracle is growing fastest from the smallest base. Its cloud infrastructure revenue rose 121% in the quarter to August 31, 2026. Google Cloud grew 82%, Microsoft’s Azure 43% and AWS 37% in the quarter to June 30.
Google Cloud
Google Cloud’s operating income more than tripled, from $2.8 billion to $8.8 billion, as revenue rose from $13.6 billion to $24.8 billion, Alphabet’s Q2 2026 release shows.
Alphabet spent $44.9 billion on property and equipment in the quarter, about twice as much as a year earlier.
On the call, Sundar Pichai said the cloud backlog had grown to $514 billion and Google’s model APIs were handling about 22 billion tokens a minute. Our Google Gemini statistics track the models behind that demand.
Google also courts early-stage teams. New customers get $300 in free credit, and seed to Series A startups can apply for up to $200,000 in GCP credits through the Google for Startups Cloud Program, or $350,000 for AI-first startups.
Microsoft Azure
Azure passed $100 billion in annual revenue for the first time in Microsoft’s fiscal year to June 2026.
In the fourth quarter, Microsoft Cloud revenue reached $59.3 billion, up 27%, and commercial remaining performance obligation rose 84% to $678 billion.
Capital spending was $41 billion for the quarter.
Satya Nadella told analysts Microsoft added 31 new datacenters in those three months, 88 in the fiscal year, and expects to about double its overall capacity in two years, according to the call transcript.
Oracle Cloud Infrastructure
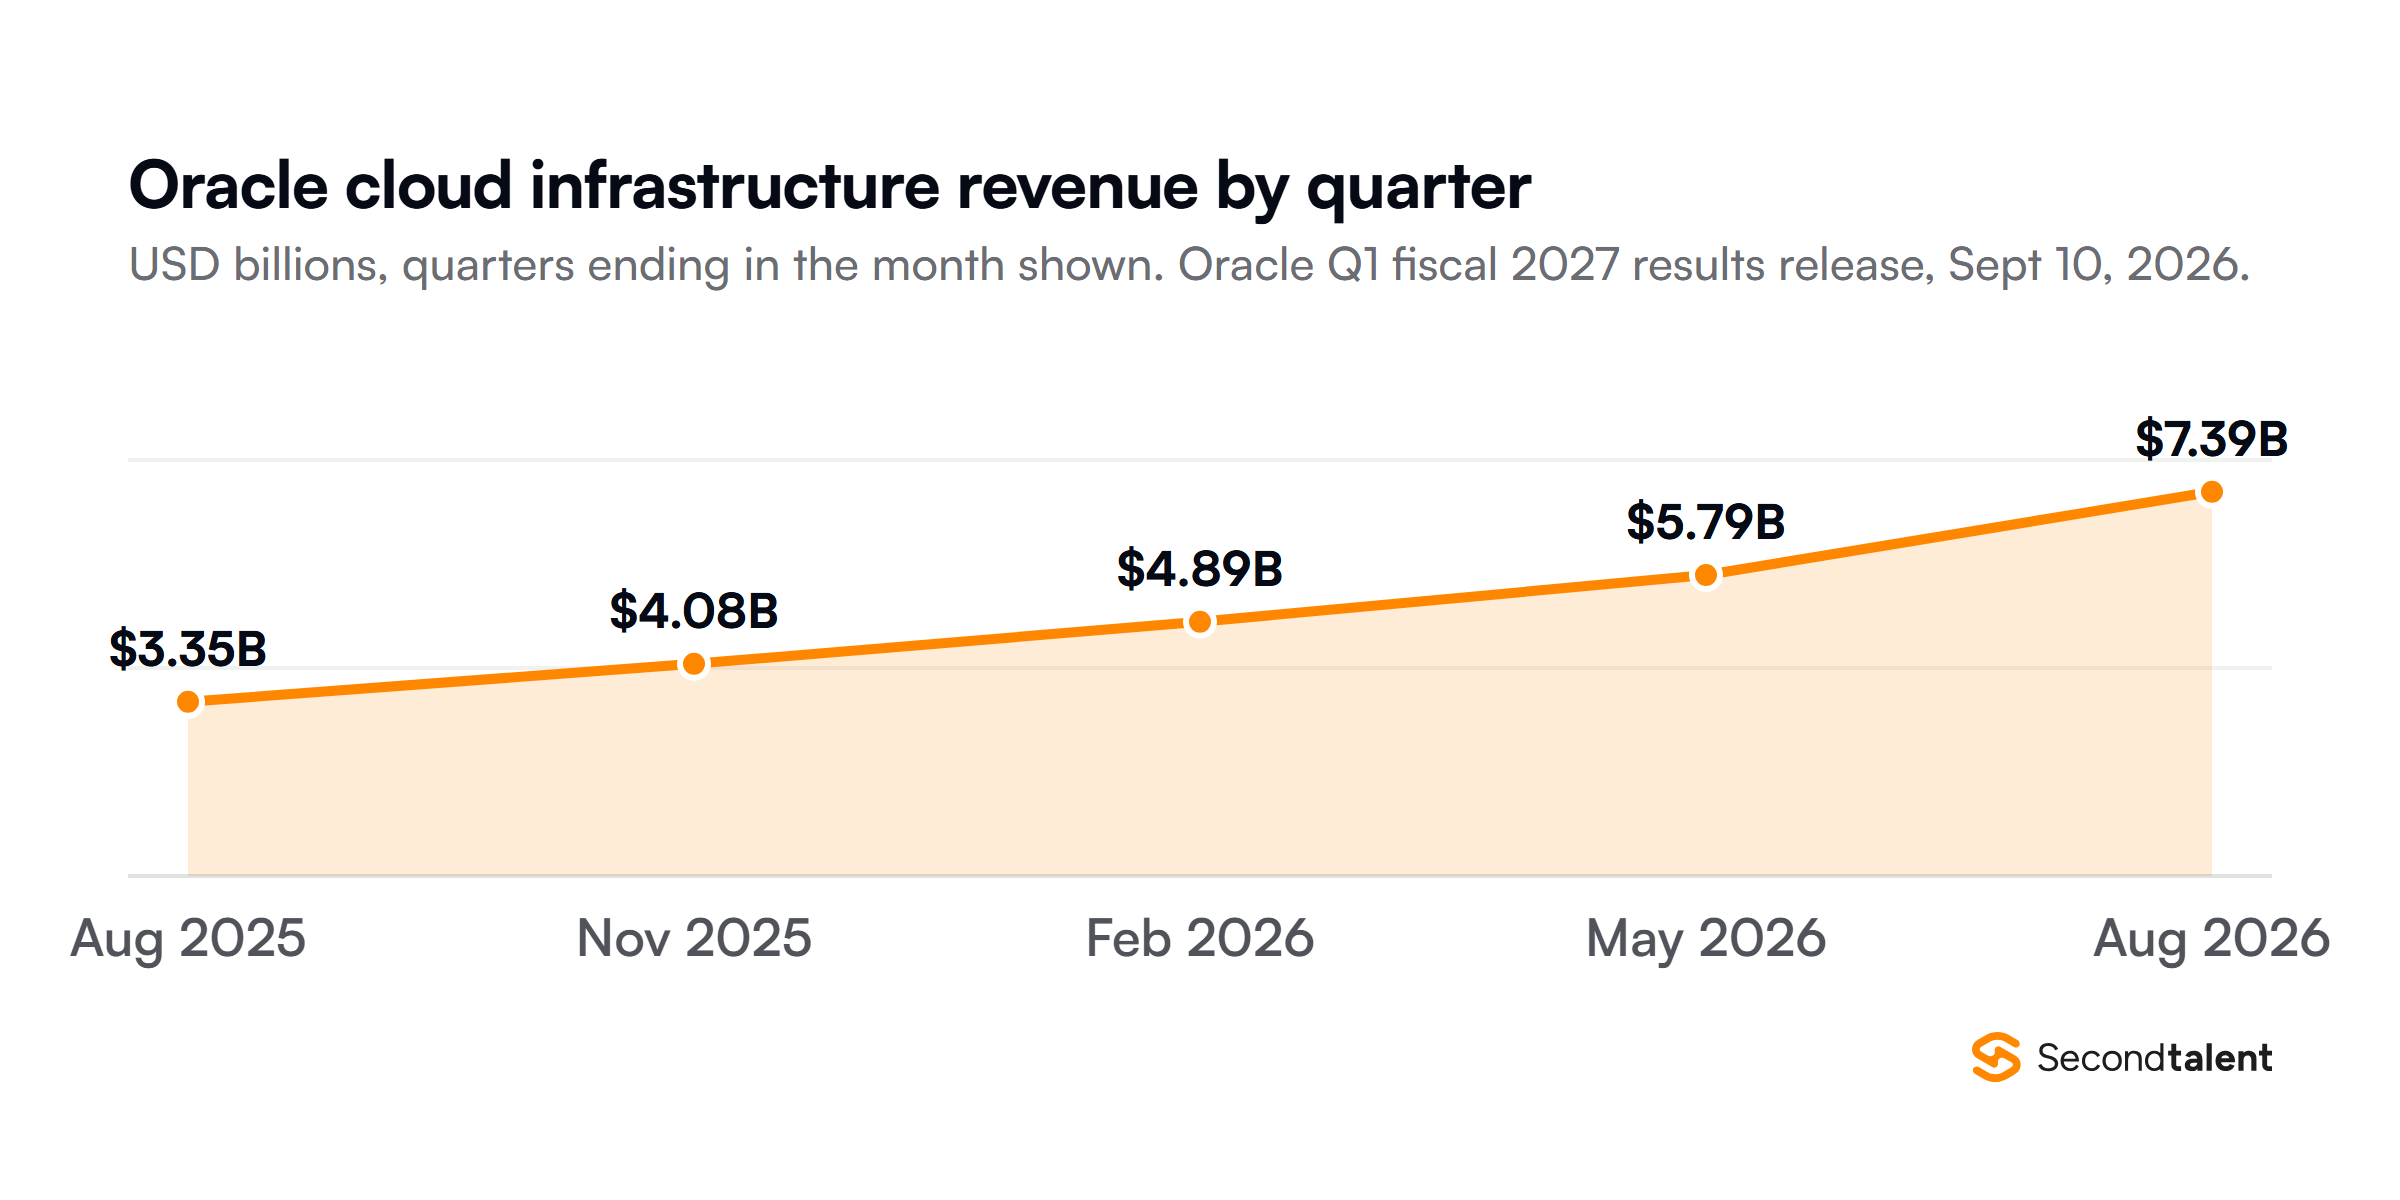
Oracle’s infrastructure business has grown faster every quarter for a year.
Revenue went from $3.35 billion in the quarter to August 2025 to $7.39 billion a year later, Oracle’s Q1 fiscal 2027 release shows, and growth climbed from 55% to 121%.
The spending behind it is heavy. Oracle delivered more than 300,000 GPUs to AI customers since its previous quarter and added 850MW of datacenter capacity.
Free cash flow was negative $5 billion, and Oracle sold $20 billion of stock during the quarter to help fund the buildout.
Backlogs point to more of the same
AWS sales grew 37% to $42.2 billion in Q2 2026, Amazon’s fastest rate in 18 quarters. Microsoft, Oracle and Google also report the contracted revenue they have yet to book.
Oracle said it booked more than $30 billion of new AI cloud contracts in its latest quarter alone. Microsoft’s figure also covers Microsoft 365 and other commercial contracts, not only Azure.
How Many Developers Build Cloud Native Software?
The cloud native developer community grew by 28% in six months, from 15.6 million in Q3 2025 to 19.9 million in Q1 2026.
That is about 39% of all developers worldwide, the CNCF and SlashData estimate, based on a survey of more than 12,500 developers.
- AI developers: 7.3 million of them now use cloud native technologies.
- Backend developers: 52% count as cloud native, up from 49% in Q1 2025.
- Platform teams: 88% of backend developers work with at least one form of infrastructure standardization, up from 80% six months earlier.
- India: an estimated 2.25 million cloud native developers as of Q1 2026.
More developers now reach Kubernetes through a platform team. The share working without any formal DevOps or platform practice fell from 20% to 12%, as internal developer platforms run by platform teams take over that layer.
Kubernetes in production
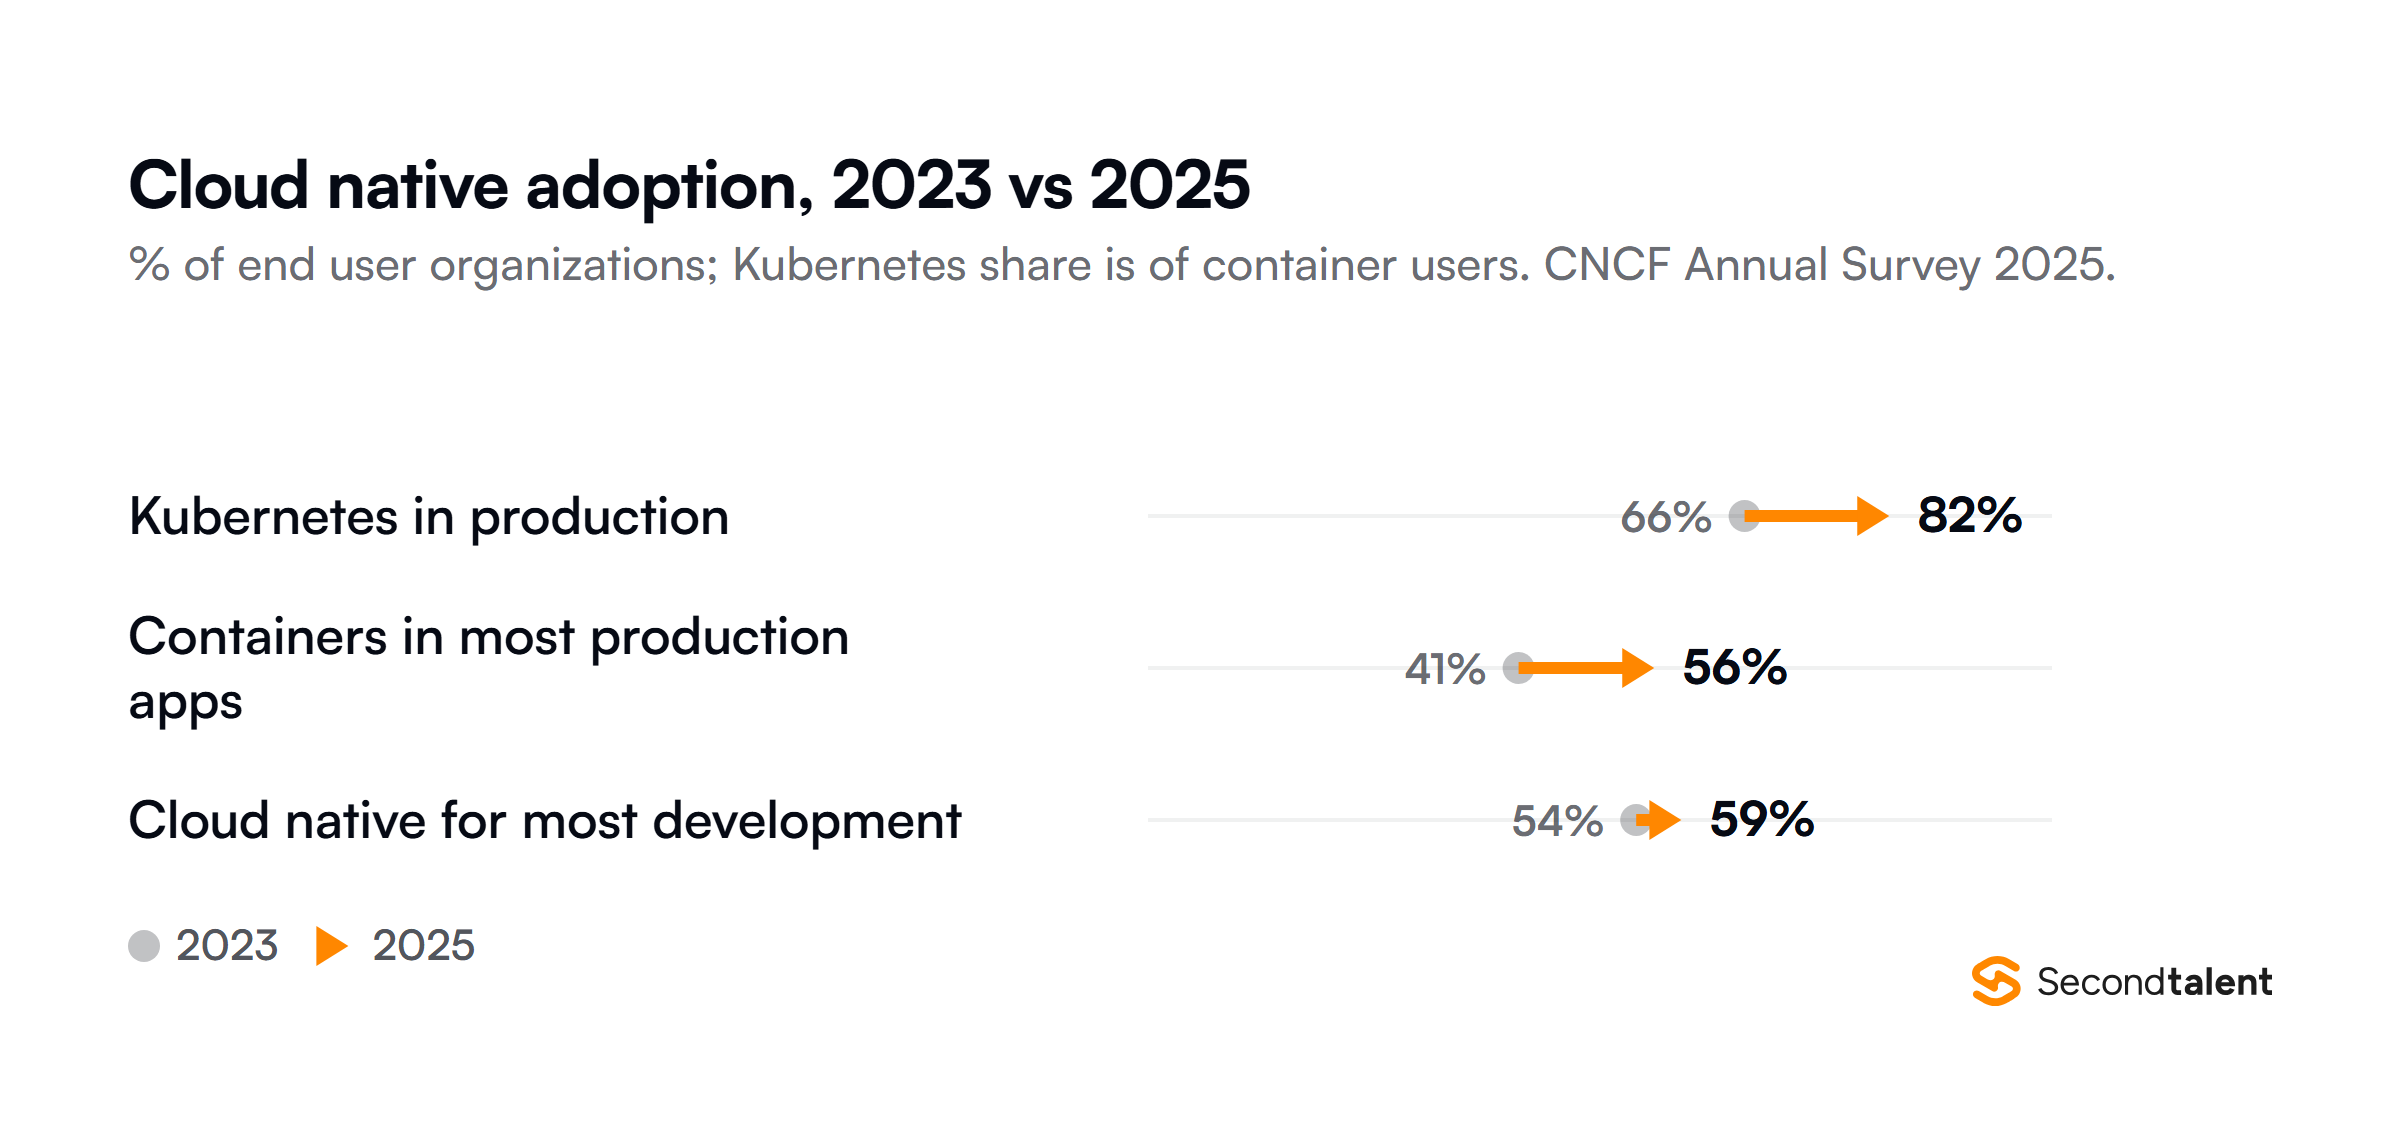
Among organizations that use containers, 82% ran Kubernetes in production in 2025, up from 66% in 2023.
The CNCF Annual Cloud Native Survey collected 628 responses in September 2025, and 98% of organizations said they use cloud native techniques in at least some of their work.
The hard part has moved from the technology to the teams. “Cultural changes with the development team” was the top container challenge, named by 47% of respondents, ahead of lack of training and security at 36% each.
AI use is still early. Of the organizations that host generative AI workloads, 23% run them fully on Kubernetes and 43% partly. Only 7% deploy AI models to production daily, and 52% of all respondents do not build or train models at all.
How Much Cloud Spend Is Wasted?
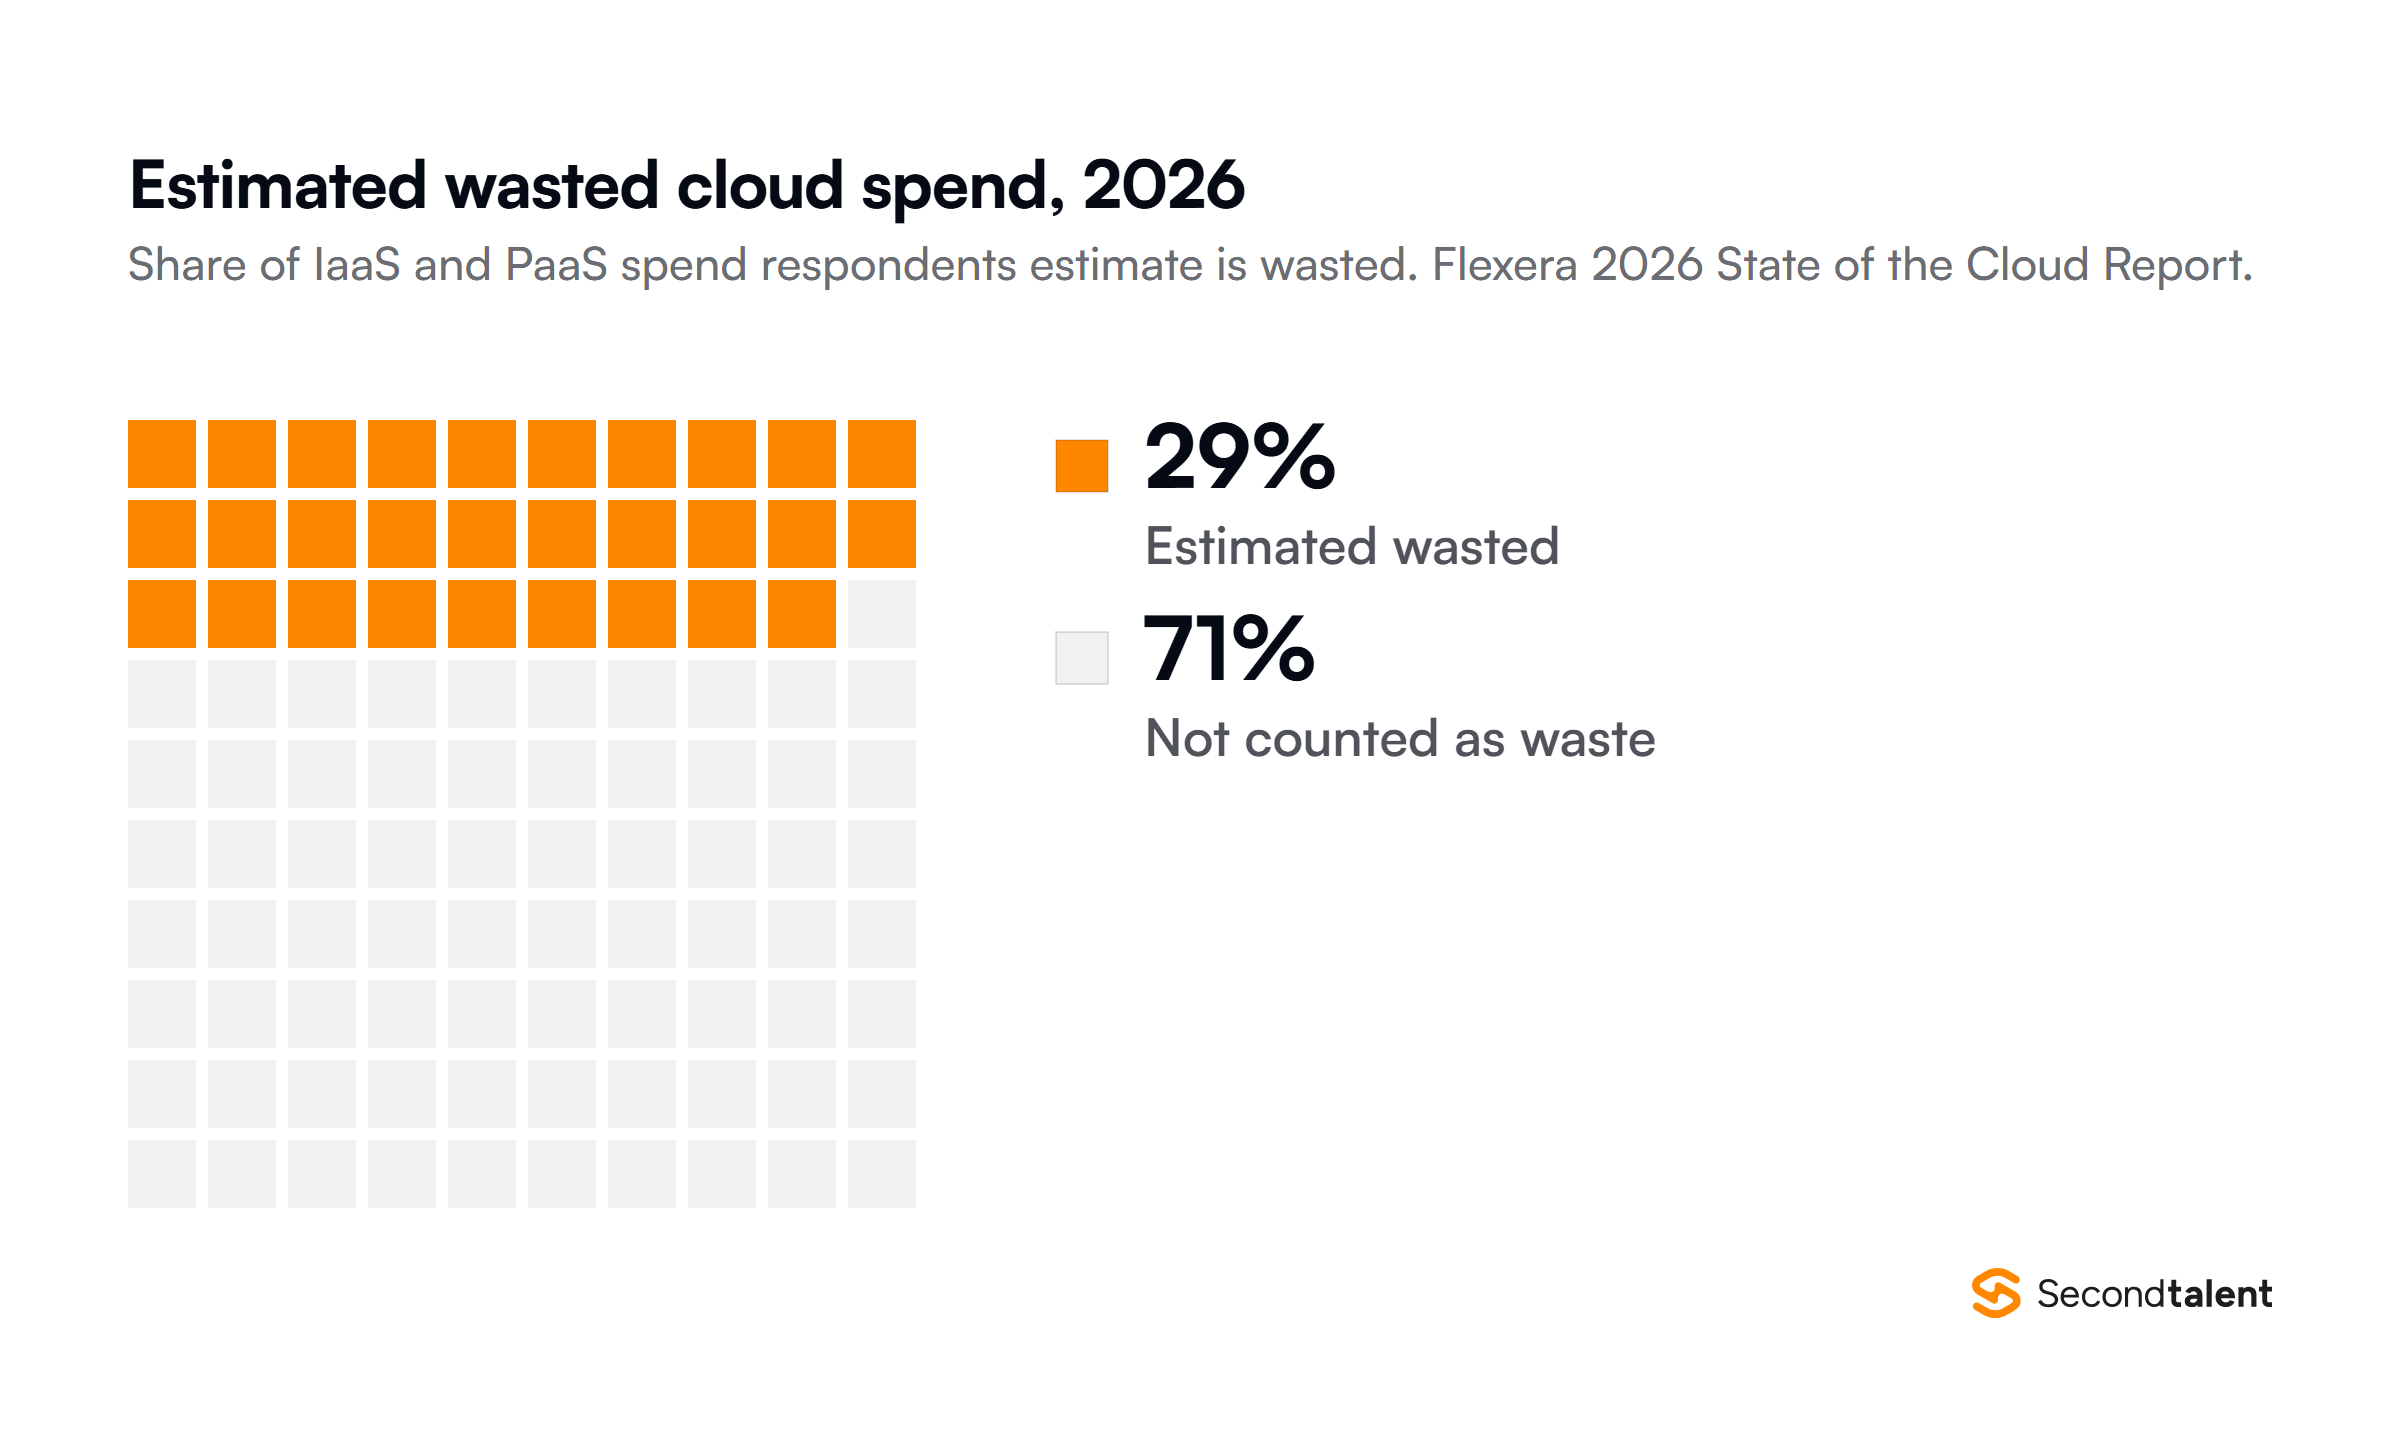
After five years of decline, estimated waste went up again. Respondents to the Flexera 2026 State of the Cloud Report, published in March, put wasted IaaS and PaaS spend at 29%.
Flexera suggests the cost complexity of AI and new PaaS services is behind the rise.
Cost has outranked security as the top cloud challenge for four years running. In 2026, 85% of respondents named managing spend and 82% named security.
Overspending is common too: 17% exceeded their public cloud budget in the past year, a share Flexera describes as stable from year to year.
More companies now staff the problem. 63% have a FinOps team and 71% a cloud center of excellence. Unit economics, measuring cost per service or customer, rose from 40% of organizations to 49%.
Our guide to the cloud FinOps engineer role covers what that job involves.
Architectures keep getting more mixed. 73% of organizations run hybrid cloud, up 3 points, but only 14% use several public clouds with no private cloud.
Generative AI services moved into third place among the public cloud services respondents use, at 58%, up from 50%.
What Do Cloud Engineers Earn in the US?
The US government does not count “cloud engineer” as its own occupation. The closest match, computer network architects, earned a median of $134,050 in May 2025, according to the Bureau of Labor Statistics.
The top 10% earned more than $202,680.
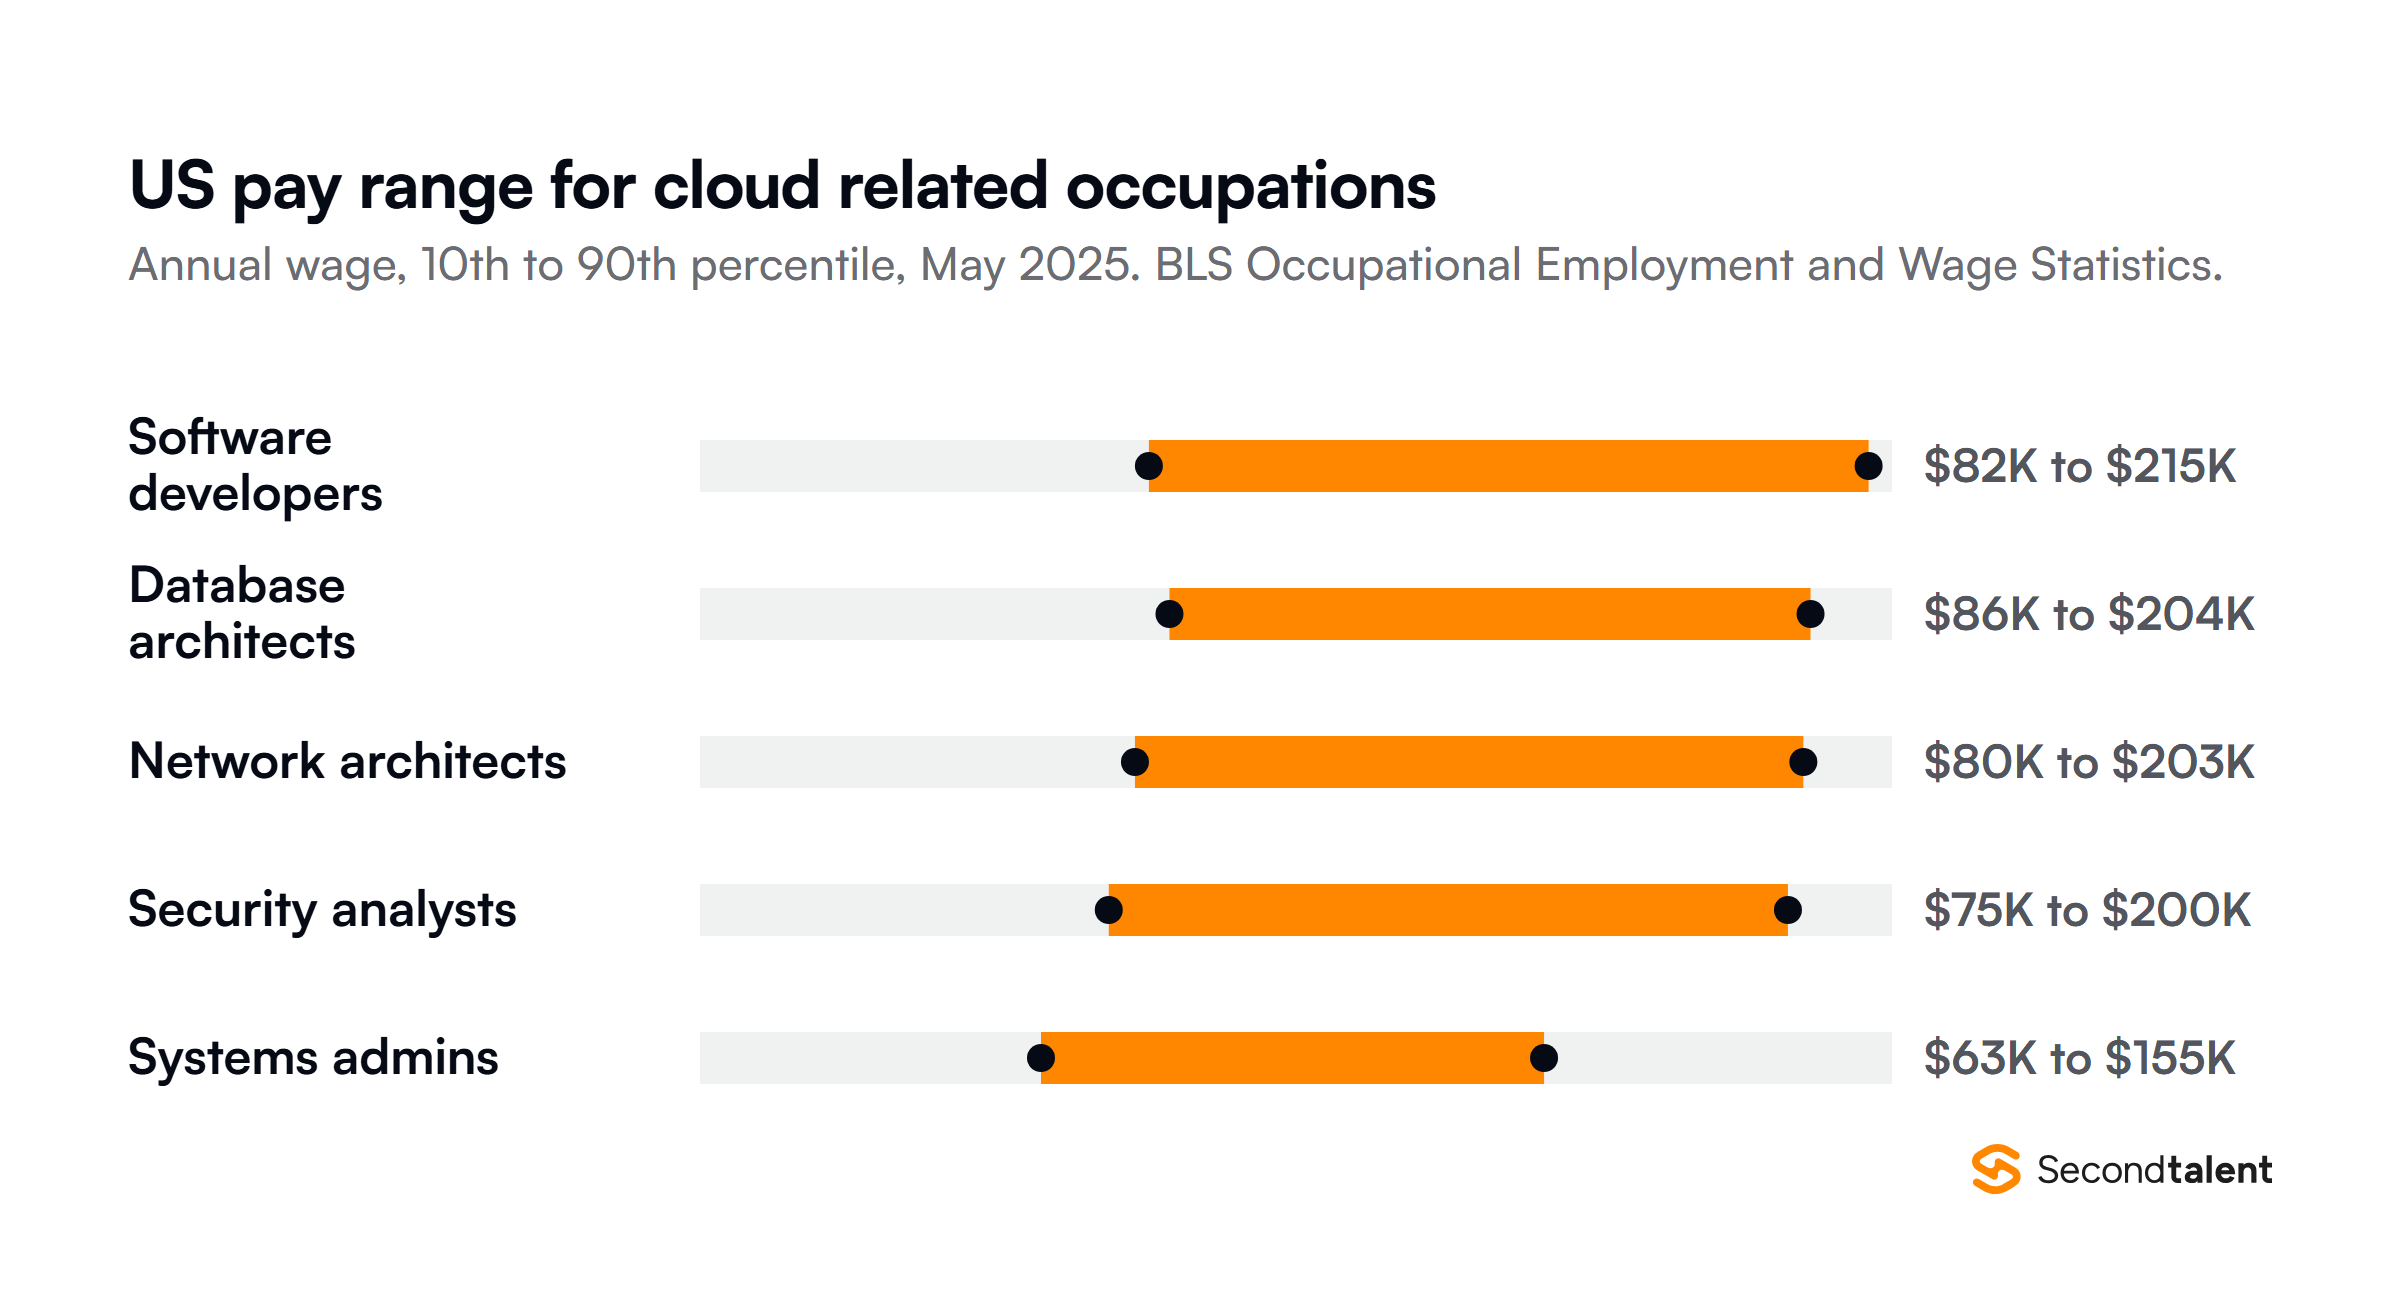
| Occupation | Median pay, May 2025 | Employed, May 2025 | Projected jobs change, 2025 to 2035 |
|---|---|---|---|
| Software developers | $135,980 | 1,687,890 | +10% (with QA analysts and testers) |
| Database architects | $139,500 | 67,140 | +9% |
| Computer network architects | $134,050 | 179,740 | +8% |
| Information security analysts | $129,180 | 190,650 | +21% |
| Network and computer systems administrators | $99,130 | 314,340 | -4% |
Pay and employment come from the BLS Occupational Employment and Wage Statistics survey. Projections come from the Occupational Outlook Handbook, and the software developer projection covers QA analysts and testers too.
The BLS links the weaker outlook for administrators to cloud and DevOps. For systems administrators, it says “some of their tasks are increasingly being done by software developers focused on DevOps.”
Database administrator jobs are projected flat because “many companies operate in the cloud, allowing fewer administrators to serve more companies at the same time.”
Hiring Cloud and DevOps Engineers
The datacenters and Kubernetes clusters above need engineers to run them. Second Talent matches companies with pre-vetted cloud engineers, DevOps engineers and Kubernetes engineers across Asia.
Our rate cards for cloud engineers in the Philippines and cloud engineers in Vietnam show what the role costs. Tell us what you are building and we will send matching profiles.
Frequently Asked Questions
Why do cloud market size figures range from $500 billion to $1 trillion?
They measure different things. Synergy and Omdia count infrastructure and platform services sold by cloud providers. IDC’s $1 trillion public cloud forecast also includes SaaS applications, which make up more than half of it.
Is cloud growth slowing down?
No. Synergy’s yearly growth rate has increased for 11 straight quarters and reached 43% in Q2 2026, the highest in eight years. Omdia forecasts 27% growth in cloud infrastructure spending for 2026.
Which cloud skills pay the most in the US?
Of the BLS occupations closest to cloud work, database architects had the highest median pay in May 2025, at $139,500. Software developers had the highest 90th percentile, at $214,670. Systems administrators earned the least of the group.
What is a neocloud?
A neocloud is a newer cloud provider focused on GPU capacity for AI. From what Synergy calls a virtual standing start two years earlier, CoreWeave joined its top ten providers at the end of 2025.
Synergy also lists AI labs OpenAI and Anthropic among its fastest-growing tier two providers.



![Programming Languages by Usage Statistics. Top 15 Programming Languages by Usage Statistics [2026], by Second Talent.](https://www.secondtalent.com/wp-content/uploads/2026/09/top-programming-usage-statistics-featured-v2-768x403.jpg)
![How to Download and Install Google's Antigravity. How to Download and Install Google's Antigravity IDE [2026], by Second Talent.](https://www.secondtalent.com/wp-content/uploads/2026/09/how-to-download-and-install-googles-antigravity-ide-featured-v2-768x403.jpg)