
TL;DR: The model performance gap between the US and China has effectively closed. As of March 2026 the leading US model is ahead by 2.7%, and the two have traded the lead repeatedly since early 2025.
The US still leads on investment, top-tier model production and infrastructure. China leads on publication volume, citations, patent output and industrial robots.
For anyone building with AI, that means model access has stopped being an advantage and application has become the scarce skill.
Most US-versus-China AI comparisons pick one metric, declare a winner, and skip the part where the two countries lead on different things. The honest picture is a split scoreboard.
Everything below comes from the 2026 Stanford AI Index Report, which is the most rigorous public dataset on this question, plus a small number of other named sources.
Where the Index warns that a number is incomplete, that warning is repeated here rather than dropped.
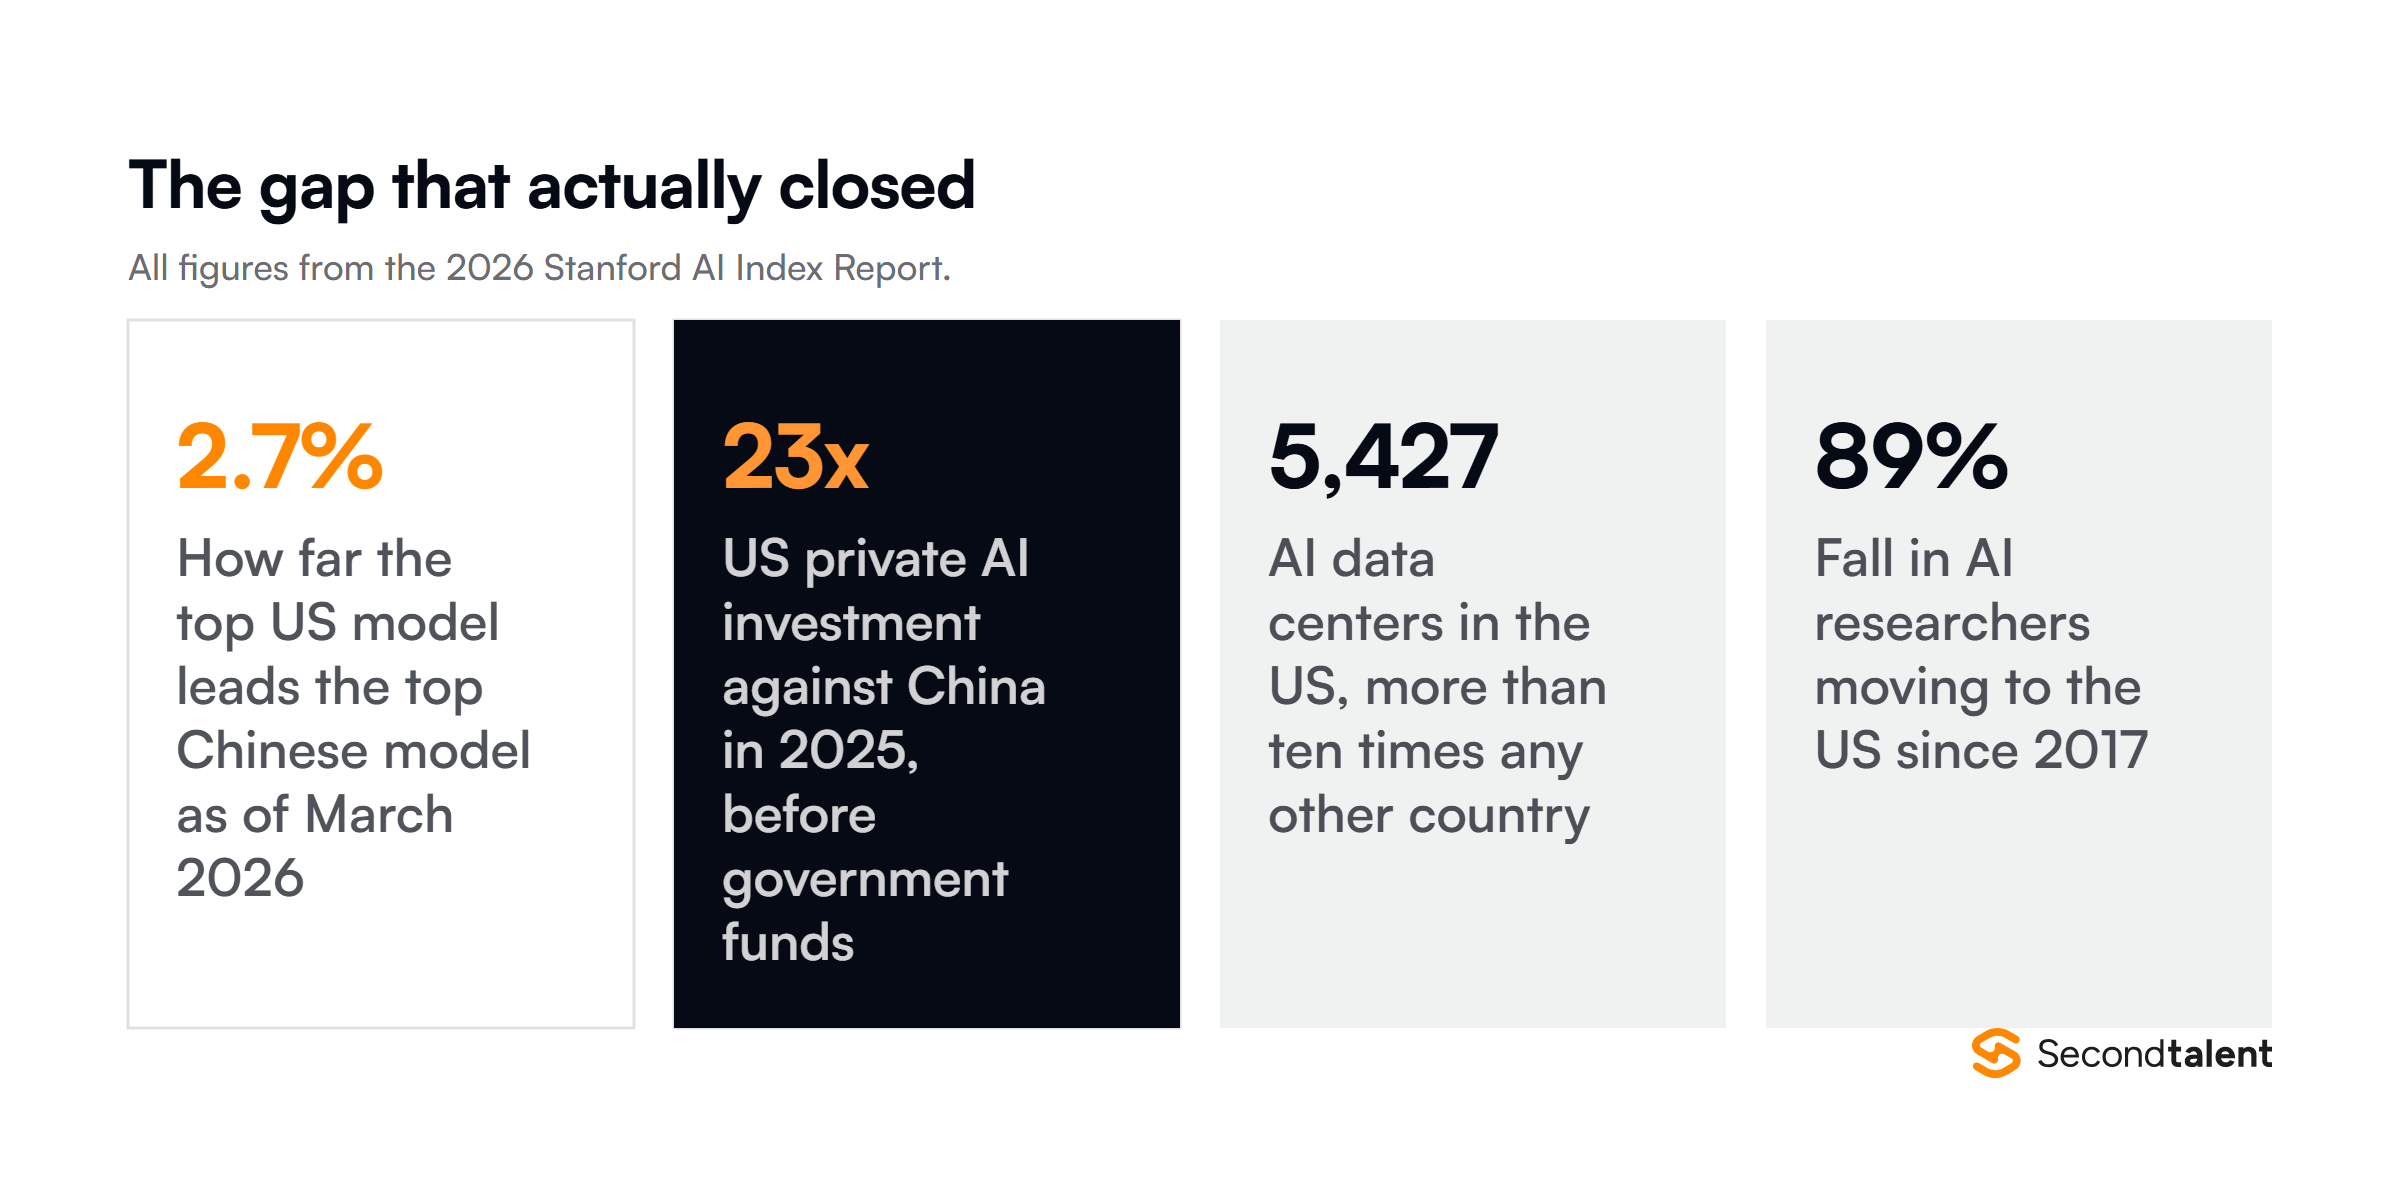
Five things that decide this comparison
- The performance gap is 2.7% and it has changed hands more than once.
- The 23x investment gap is real but incomplete, because it counts private money only.
- China leads on volume of research output. The US leads on impact and infrastructure.
- Nearly every leading AI chip is fabricated by one company in Taiwan.
- US inbound AI talent is down 89% since 2017, which is the trend line most likely to matter next.
The performance gap has effectively closed
This is the headline finding, and it reverses the framing most comparisons still use. The 2026 AI Index reports that US and Chinese models have traded the lead multiple times since early 2025.
DeepSeek-R1 briefly matched the top US model in February 2025. As of March 2026, the leading US model is ahead by 2.7%. A gap that small is not a moat. It is a release cycle.
Two things follow. Choosing a model on nationality no longer buys you capability, and any architecture that assumes one provider stays ahead is betting on something the data does not support.
Where each country actually leads
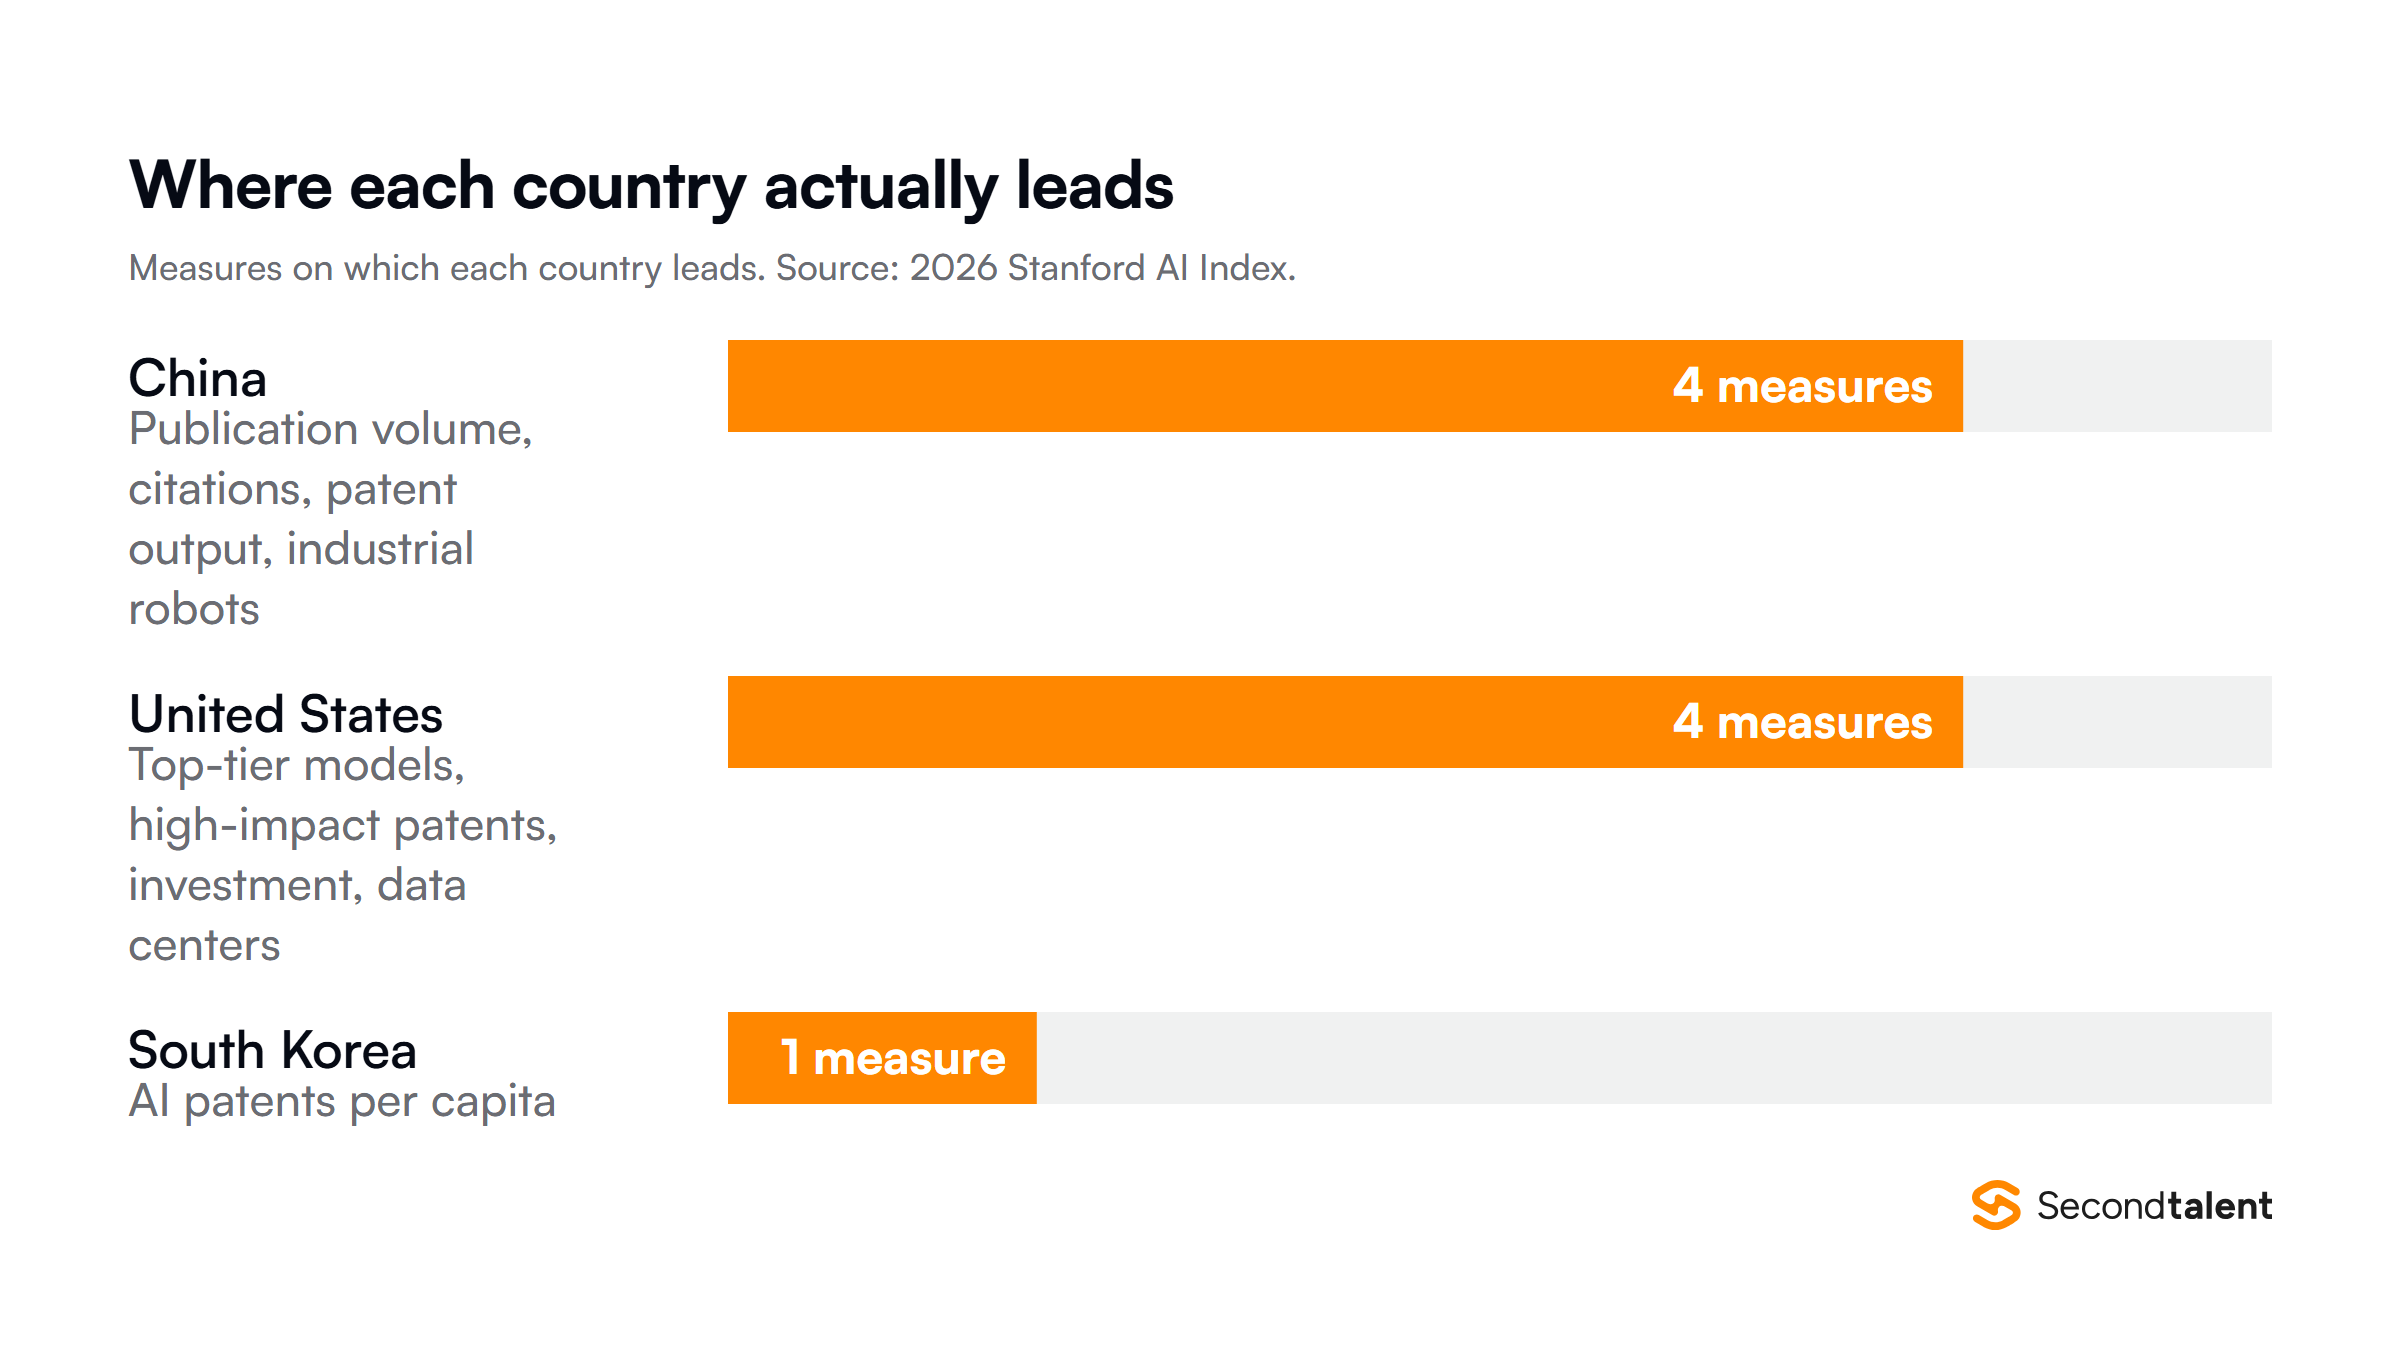
The Index splits leadership rather than awarding it:
- China leads on publication volume, citations, patent output and industrial robot installations.
- The US leads on top-tier model production, higher-impact patents, private investment and data centre capacity.
- South Korea leads the world on AI patents per capita, which is the kind of result a two-country framing hides entirely.
Note the difference between volume and impact. China publishes more and is cited more; the US produces the patents with higher impact scores.
Both are true, and a comparison that quotes only one is picking a side rather than describing the field.
The investment gap, and why the headline number misleads
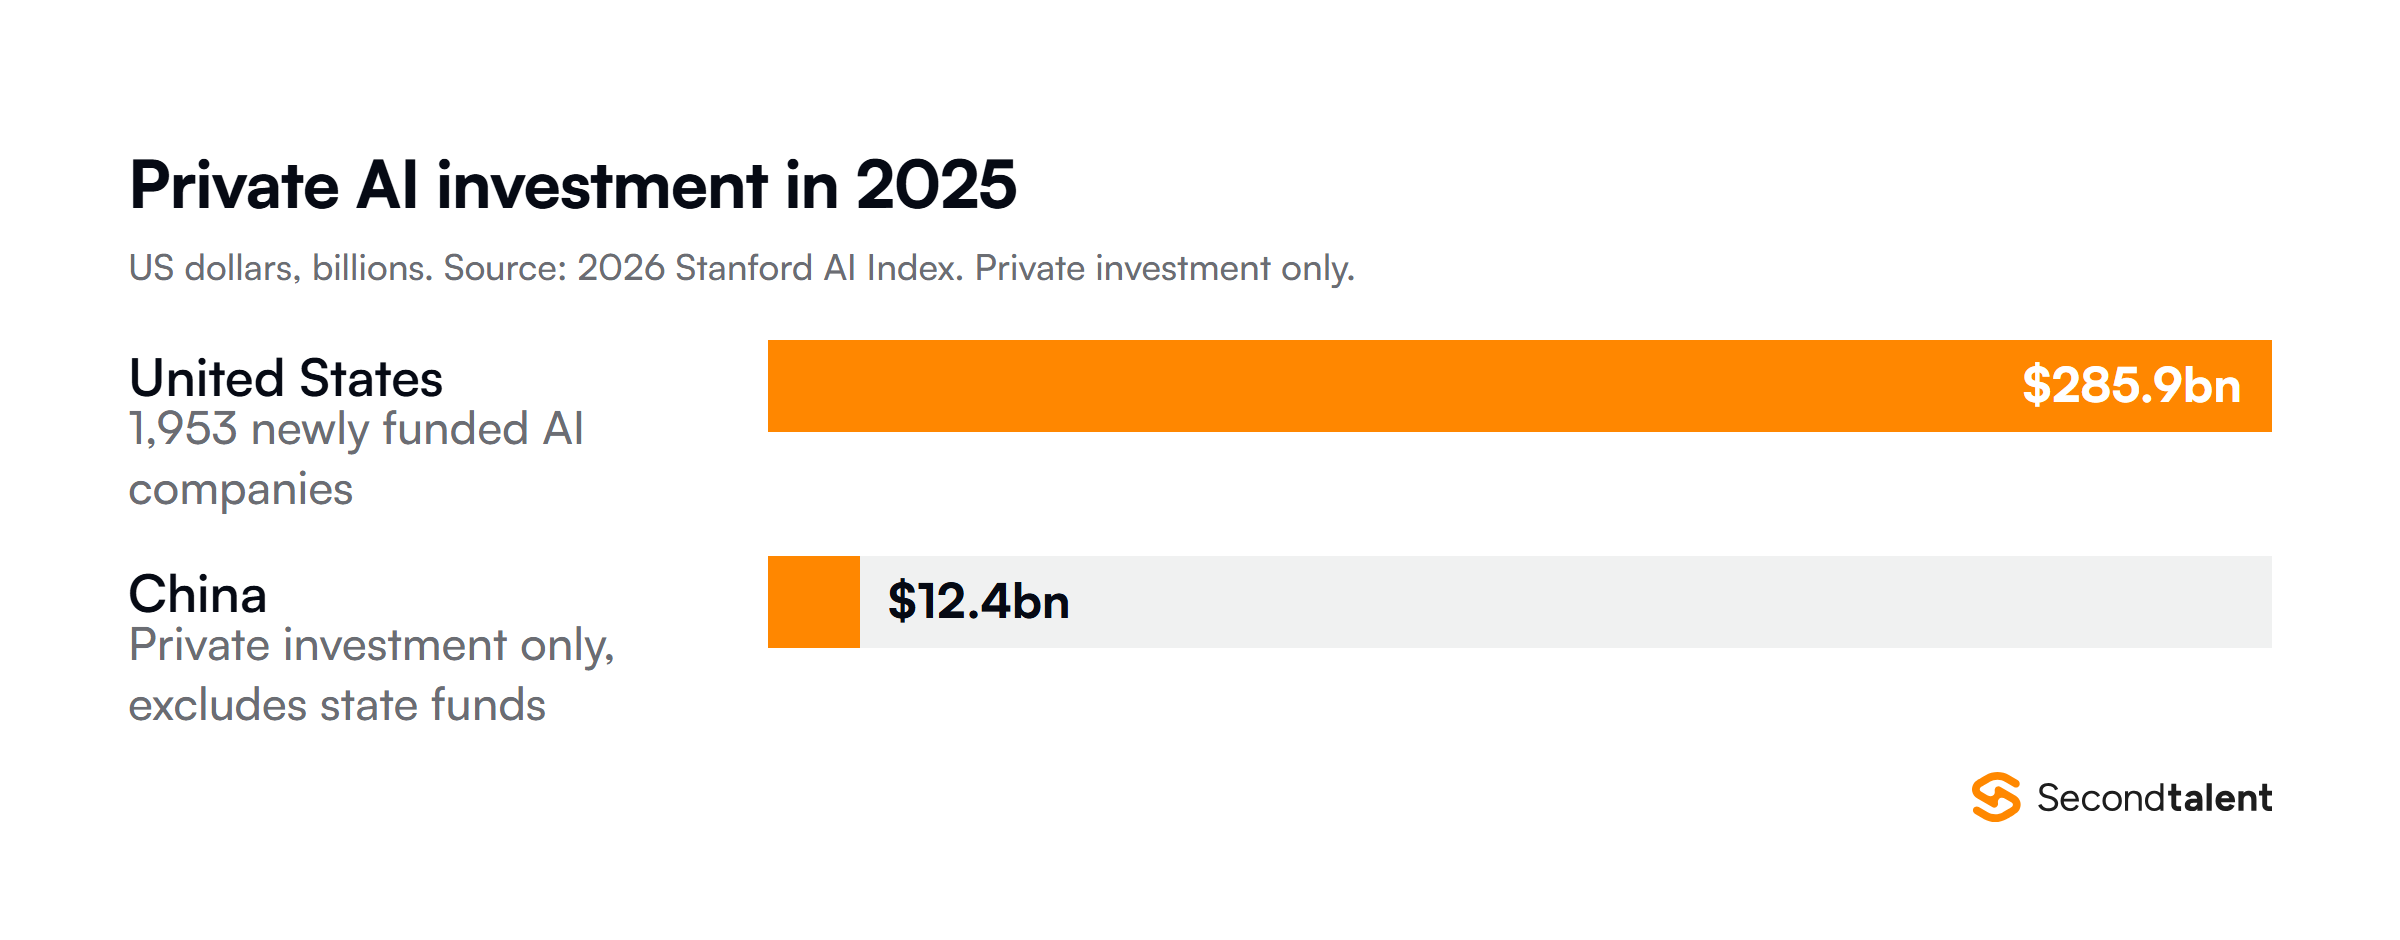
US private AI investment reached $285.9 billion in 2025 against $12.4 billion in China, a ratio of more than 23 to 1. The US also produced 1,953 newly funded AI companies, more than ten times the next closest country.
Read that ratio carefully. The AI Index states plainly that private investment figures understate China’s total, because a large share of Chinese AI funding moves through government guidance funds that these numbers do not capture. The 23x figure is accurate for what it measures and misleading as a summary of national effort. Anyone quoting it without the caveat is quoting half a sentence.
This is the single most misused number in the comparison. It is worth carrying the caveat every time you use it.
Infrastructure, and a single point of failure
The US hosts 5,427 AI data centres, more than ten times any other country, and consumes more energy on them than anywhere else. On raw compute footprint the contest is not close.
The more interesting fact sits underneath it. Almost every leading AI chip is fabricated by a single company, TSMC, in Taiwan. A TSMC expansion in the US began operations in 2025, but the dependency is still concentrated in one foundry.
So the US compute advantage and China’s compute constraint both run through the same chokepoint. Treating them as two independent national capabilities misreads how the supply chain actually works.
Adoption does not follow the leaderboard
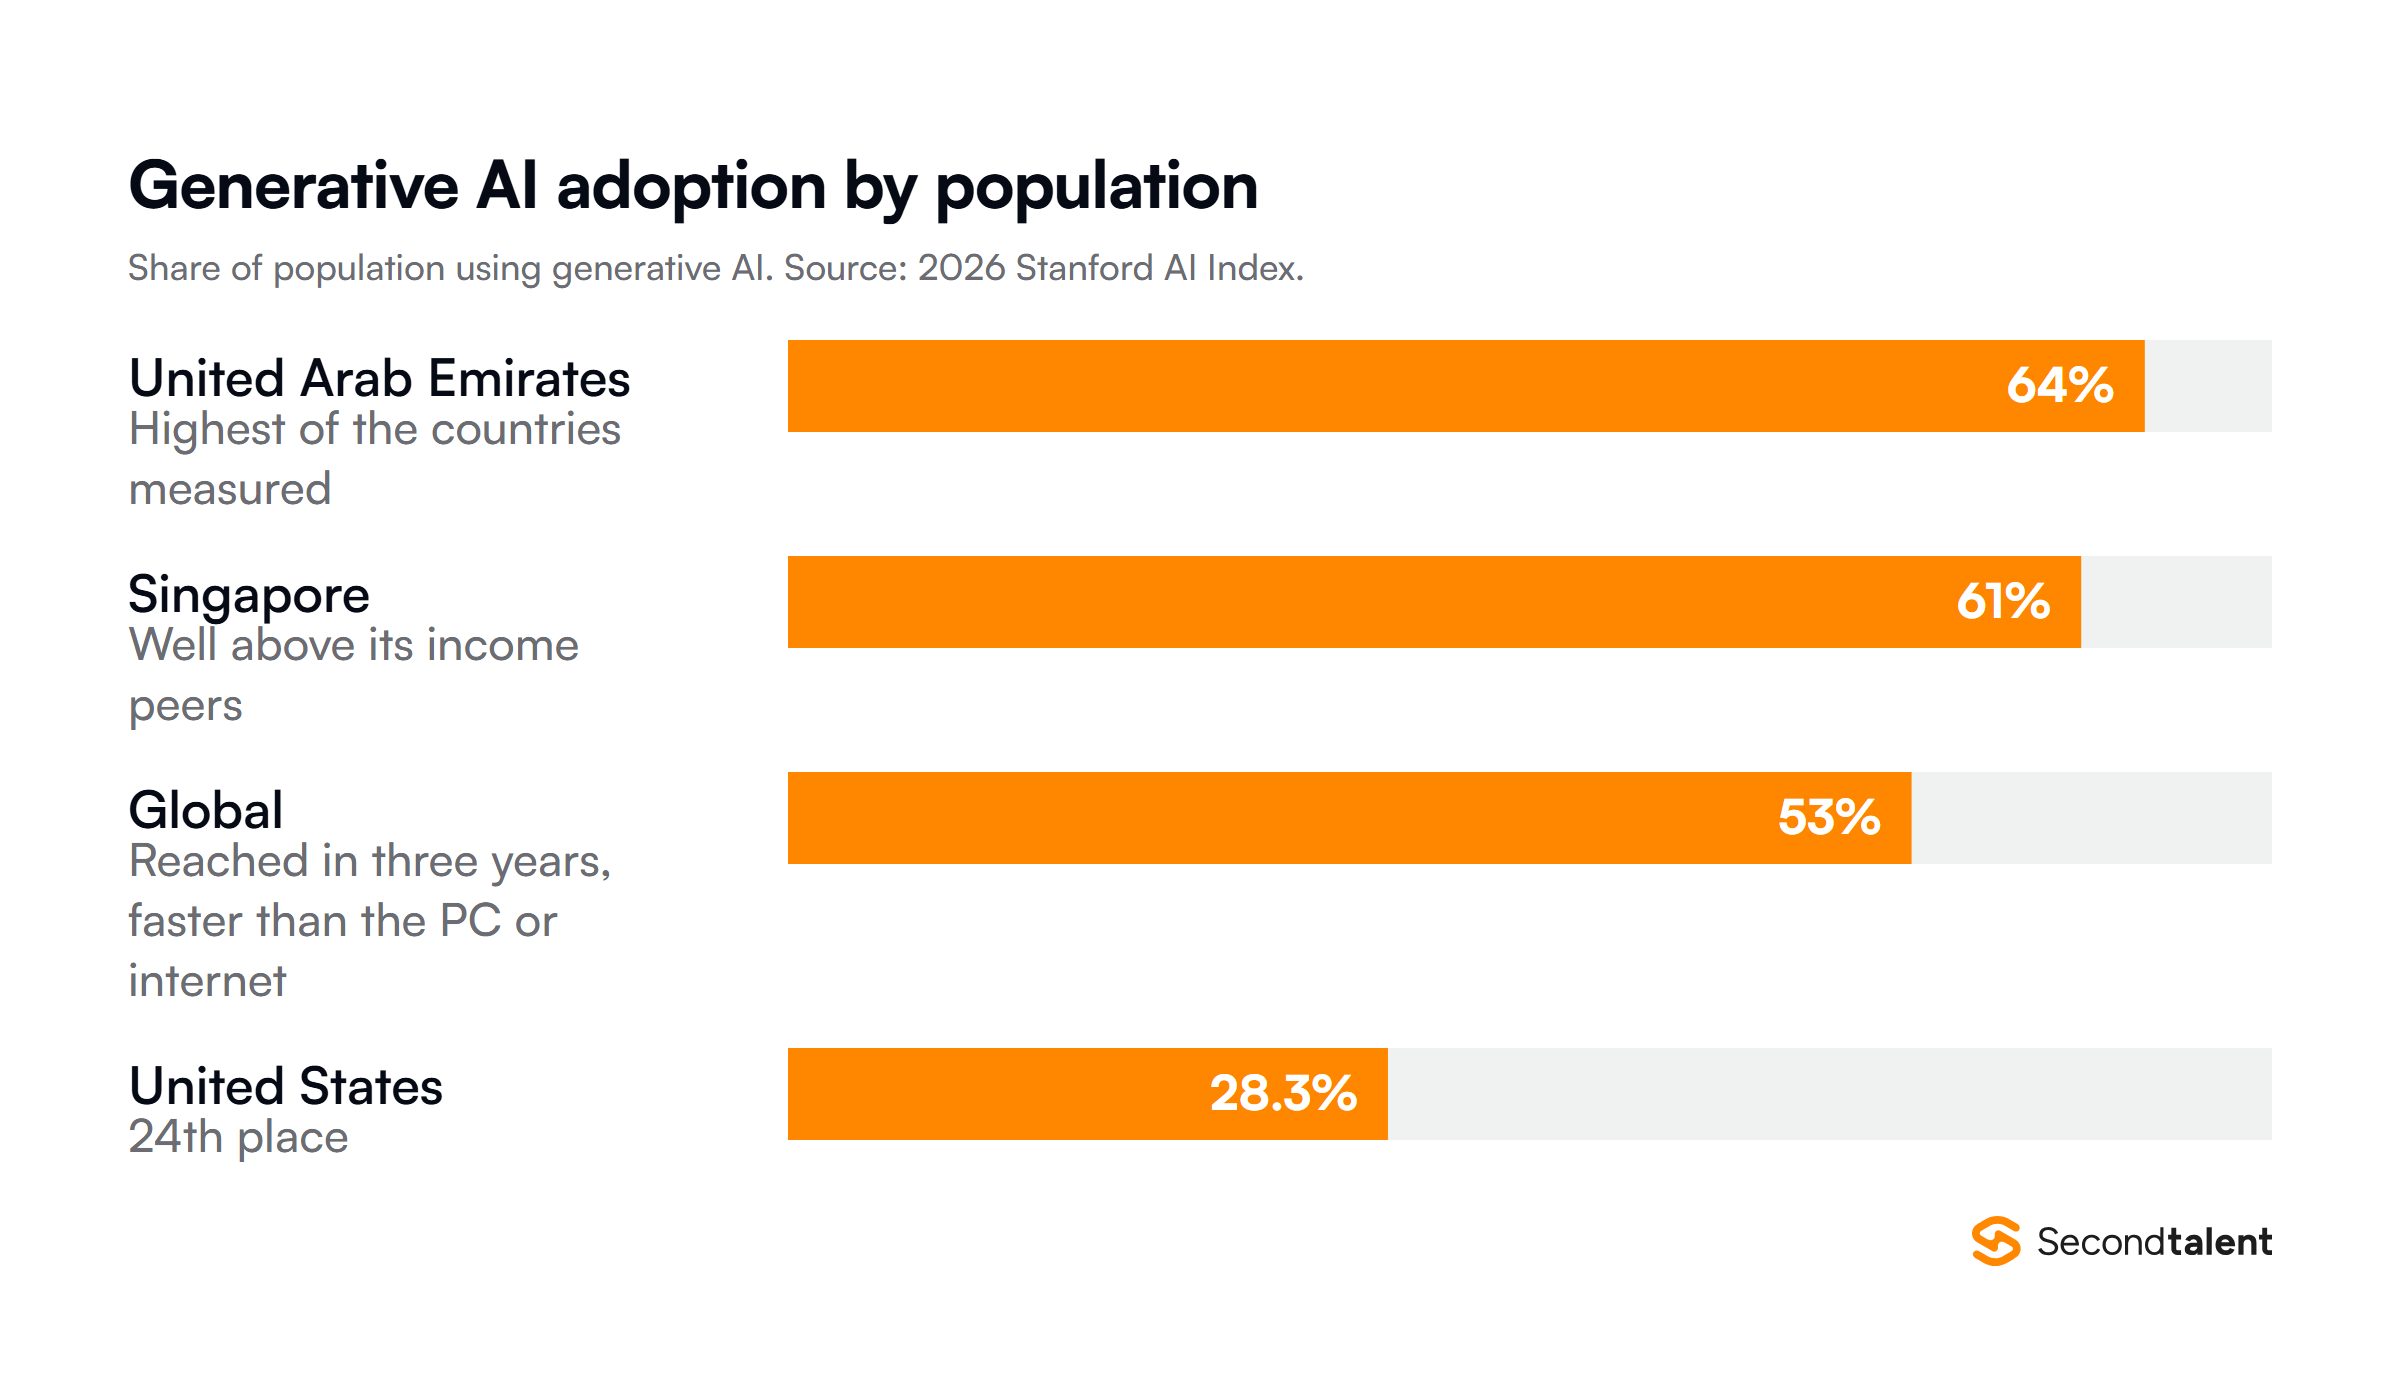
Generative AI reached 53% population adoption within three years, faster than the PC or the internet.
Adoption correlates with GDP per capita, but several countries sit well above their income line: Singapore at 61% and the United Arab Emirates at 64%.
The United States ranks 24th, at 28.3%. The country that leads on investment, models and infrastructure is not the country where the most people use the technology.
If you are hiring engineers who need to build for users who already use AI daily, that ranking is more useful than the model leaderboard.
It is also part of why teams across Singapore, Vietnam and China are worth looking at for AI-adjacent work.
The talent flow reversed
The number of AI researchers and developers moving to the United States has fallen 89% since 2017, with an 80% decline in the last year alone.
That is the finding most likely to change the picture over the next few years. Model leads are measured in months; a decade-long reversal in where researchers choose to live is measured in careers.
Meanwhile the developer population is growing fastest well outside both countries.
GitHub’s Octoverse report counts more than 180 million developers, with India at 21.9 million after adding 5.2 million in 2025 alone, and Brazil and Indonesia both more than quadrupling since 2020.
The pipeline behind that flow is shifting too. New AI PhDs in the US and Canada rose 22% between 2022 and 2024, but the graduates driving that increase took academic jobs rather than industry ones.
Meanwhile AI engineering skills are accelerating fastest in the United Arab Emirates, Chile and South Africa, none of which appear in a two-country comparison.
Formal education is lagging the technology in both directions.
Over 80% of US high school and college students now use AI for schoolwork, yet only half of middle and high schools have an AI policy at all, and just 6% of teachers describe the policy they do have as clear.
What the benchmark race does not tell you
A 2.7% gap sounds decisive until you look at what the models can and cannot do, which the AI Index calls the jagged frontier.
Gemini Deep Think earned a gold medal at the International Mathematical Olympiad. The top model reads an analog clock correctly 50.1% of the time. Both facts are from the same report and the same year.
Agents show the same shape. Task success on OSWorld, which tests agents on real computer tasks across operating systems, jumped from 12% to about 66%. That is a large gain and it still means failing roughly one attempt in three.
Capability is also outrunning the safety work around it. Documented AI incidents rose to 362, up from 233 in 2024, while reporting on responsible AI benchmarks stayed patchy compared with capability benchmarks.
Recent research also found that improving one responsible AI dimension, such as safety, can degrade another, such as accuracy.
The practical read for a team: whichever model you pick, you are buying something that is superhuman in narrow places and unreliable in ordinary ones. That is an engineering problem, and it is the same engineering problem on both stacks.
Where the work actually gets done
National comparisons imply that engineers sit inside national borders. Increasingly they do not, and the pattern is not the one people assume.
In the 2025 Stack Overflow Developer Survey of 33,686 respondents, 32.4% of developers worldwide worked fully remote against 17.9% fully in person. The US led on remote work at 45%.
In India, in-person was the single largest arrangement at 30.5%, ahead of remote at 25.6%.
So the assumption that offshore automatically means remote-native is backwards more often than not. It is worth checking before you design a distributed team around it.
On the demand side, the World Economic Forum’s Future of Jobs Report 2025 projects 170 million new roles created and 92 million displaced by 2030, a net gain of 78 million, with disruption equal to 22% of jobs.
Technology and AI roles are the fastest growing group in that set.
What experts and the public disagree about
On whether AI will improve how people do their jobs, 73% of experts expect a positive impact against 23% of the public. That is a 50-point gap, and it shows up on the economy and medical care too.
Trust in regulation splits differently again.
Among surveyed countries the US reported the lowest trust in its own government to regulate AI, at 31%, and globally the EU is trusted more than either the US or China to regulate it effectively.
What this means if you are building with AI
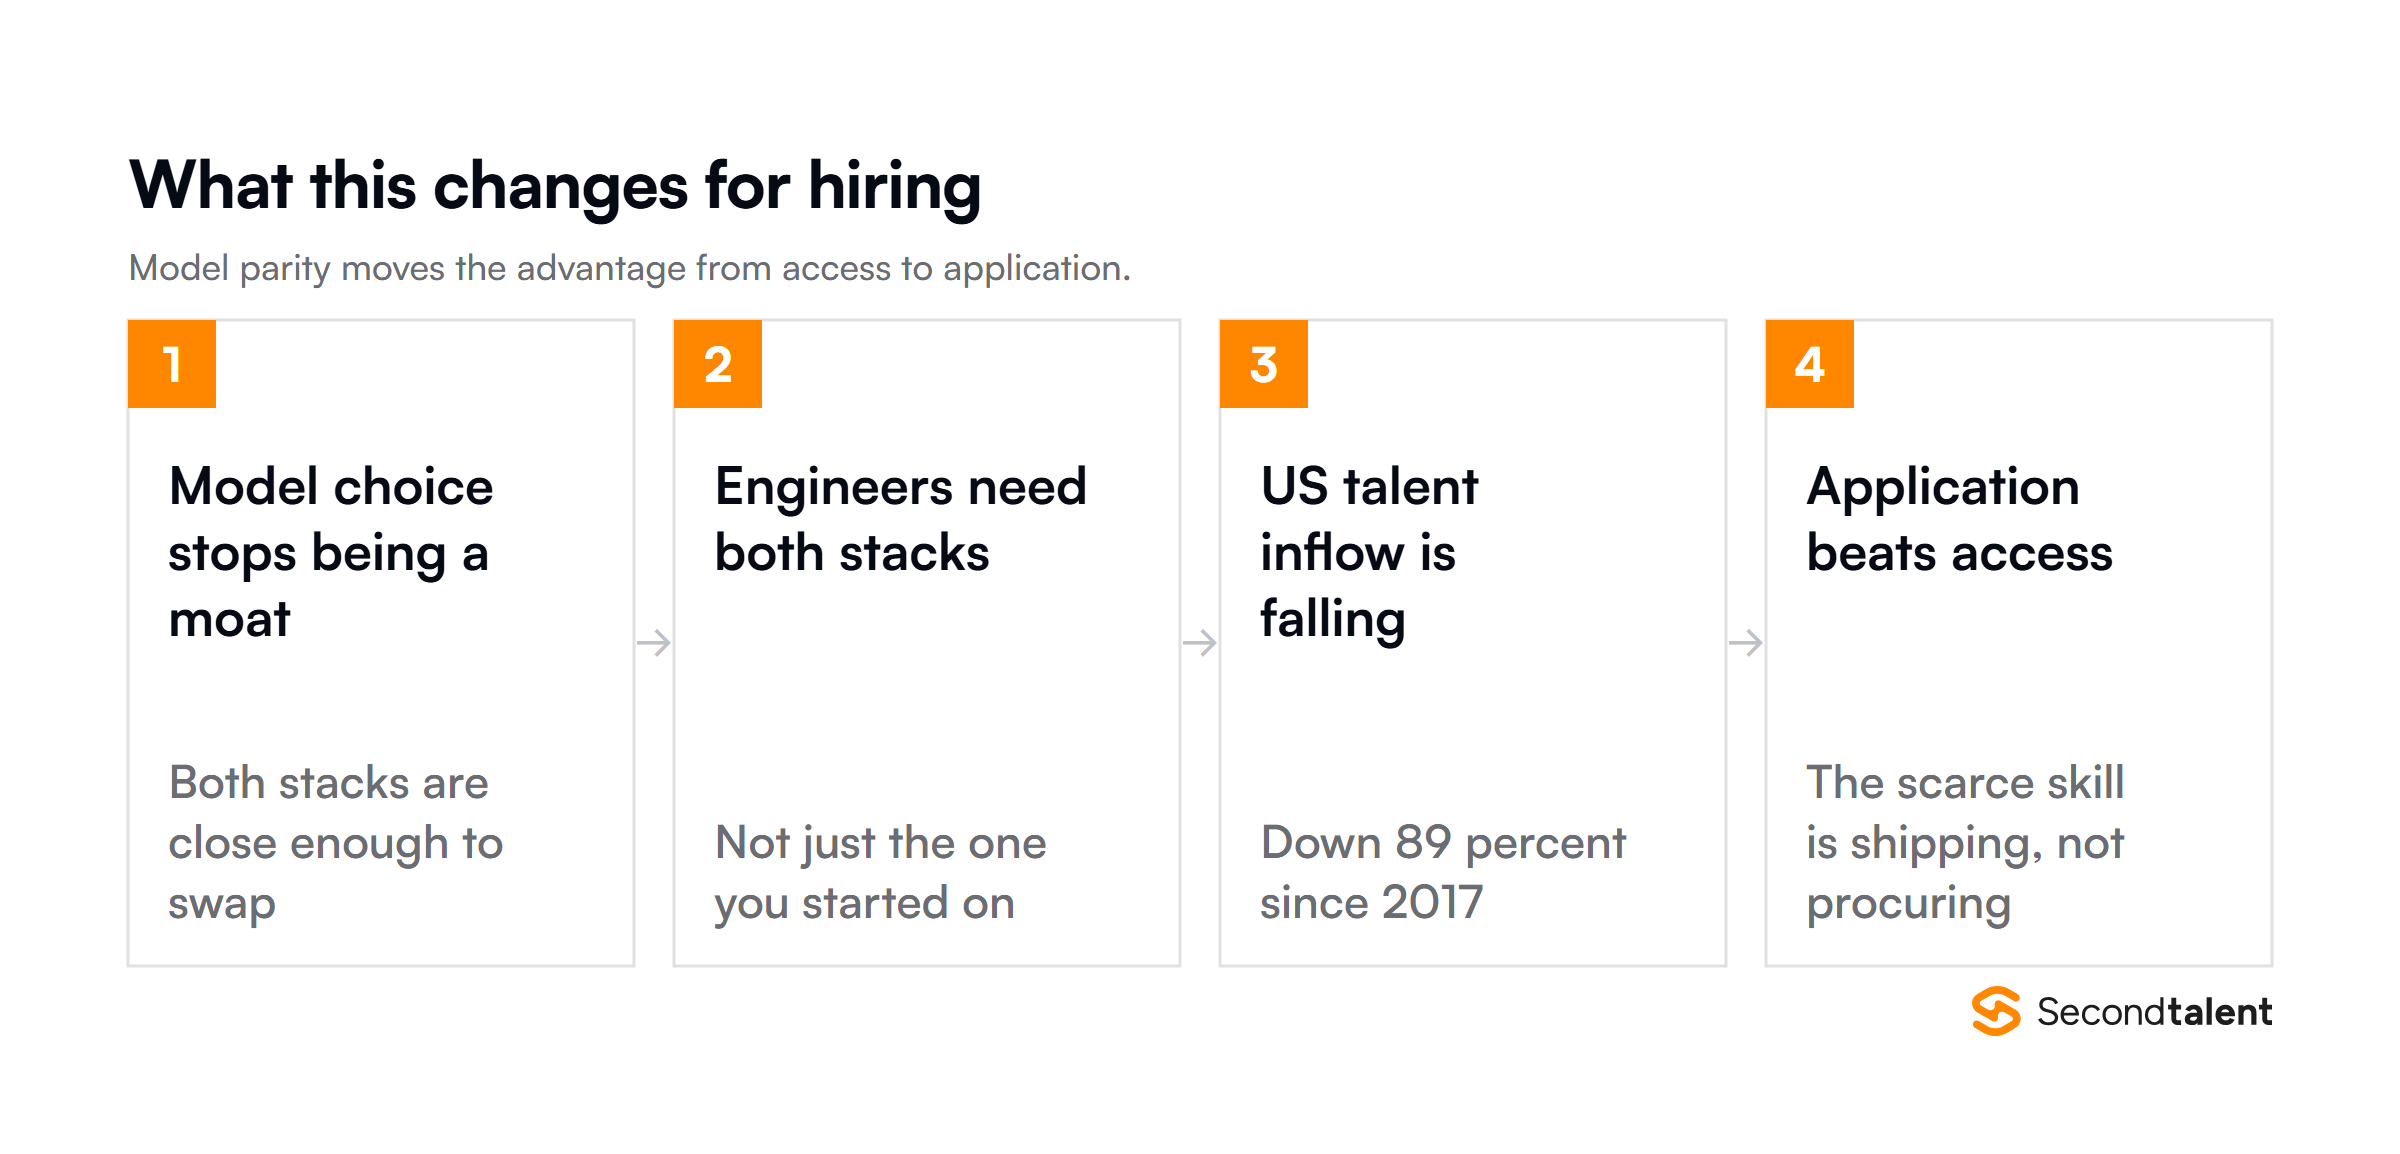
Model parity moves the advantage from access to application. When the top two models are within a few percent of each other, the differentiator is no longer which one you can call.
It is whether your team can ship something useful on top of either.
In practice that means hiring engineers who have worked across more than one stack.
McKinsey’s 2026 State of AI survey found that about two in ten organizations are scaling AI agents, rising to 40% at enterprises above $1 billion in revenue, while 37% report any EBIT impact at all.
The constraint is execution, not availability.
We test AI tool fluency during vetting rather than taking it from a CV, which is the only way to tell the two groups apart.
Our AI and machine learning engineers and agentic AI specialists are the profiles that come up most for this work, and the developer rate card covers what they cost across markets.
Building on either stack? Tell us what you are building and we will match you with vetted engineers in about 24 hours.
Frequently asked questions
Is China ahead of the US in AI?
Not overall, and not behind either. The 2026 Stanford AI Index reports the model performance gap as effectively closed, with the top US model ahead by 2.7% as of March 2026.
China leads on research volume, citations, patents and industrial robots; the US leads on top-tier models, high-impact patents, investment and infrastructure.
How much more does the US invest in AI than China?
US private AI investment was $285.9 billion in 2025 against $12.4 billion in China, more than 23 times.
The Index cautions that this counts private money only and understates China’s total, which flows substantially through government guidance funds.
Are Chinese LLMs good enough to build on?
On benchmark performance, yes. The two countries’ leading models have traded first place repeatedly since early 2025. Your decision should turn on licensing, data residency and support rather than on capability alone.
Which country uses AI the most?
Neither. Generative AI adoption is highest in the United Arab Emirates at 64% and Singapore at 61%, against a global figure of 53%. The US ranks 24th at 28.3%.
What is the biggest risk in the AI supply chain?
Concentration. Almost every leading AI chip is fabricated by TSMC in Taiwan. A US expansion started operating in 2025, but the dependency on one foundry remains the structural risk both countries share.






![Countries With the Highest Software Engineer Salaries. Top 10 Countries With the Highest Software Engineer Salaries [2026], by Second Talent.](https://www.secondtalent.com/wp-content/uploads/2026/09/countries-with-highest-software-engineer-salaries-featured-v2-768x403.jpg)