TL;DR: Observability interviews in 2026 test OpenTelemetry instrumentation and the Collector, trace sampling, Prometheus metrics and SLO burn-rate alerting. Candidates should know that OpenTelemetry graduated at the CNCF in May 2026, that native histograms became stable in Prometheus 3.8, and that OpenTelemetry now tells new code to emit events as logs rather than span events.
The CNCF graduated OpenTelemetry on May 21, 2026. Two months earlier its Profiles signal entered public alpha, putting continuous profiling next to traces, metrics and logs in one vendor-neutral protocol.
Prometheus moved in parallel: version 3.0 turned on UTF-8 metric names and an OTLP receiver in November 2024, and 3.15 shipped on September 25, 2026.
An observability engineer is now expected to work across both ecosystems, and the questions below reflect that.
- 1OpenTelemetry SDKs cap each metric at 2,000 attribute combinations by default and fold the rest into one overflow point, so high-cardinality labels silently skew filtered queries.
- 2Tail sampling needs every span of a trace on the same Collector, which is why it runs behind a load-balancing exporter tier.
- 3The Google SRE Workbook pages on a 14.4x burn rate over one hour for a 99.9% SLO, which spends 2% of a 30-day error budget.
- 4Jaeger v2, released in November 2024, is built on the OpenTelemetry Collector rather than its own agent and collector.
Core Principles
1. What is the difference between monitoring and observability?
Monitoring checks for failures you predicted: a dashboard of CPU, a 5xx alert. Observability is the ability to explain failures you did not predict, by asking new questions of telemetry the system already emits, without shipping new code.
In practice the difference is the data. Pre-aggregated metrics answer "is the error rate up?". Traces and structured events with rich attributes answer "which customers, on which build, calling which dependency, see the errors?".
A strong candidate says observability does not replace monitoring; alerts still come from a few well-chosen metrics.
2. How do logs, metrics and traces connect?
Through shared identifiers and shared resource attributes. A trace ID in every log line lets you jump from a trace to the logs it produced.
Exemplars attach a sample trace ID to a metric data point, so a latency spike on a graph links to one slow request.
The same service.name, deployment.environment.name and Kubernetes attributes on all three signals let you pivot between them.
The usual workflow runs in one direction: an alert fires on a metric, an exemplar or a trace search finds a slow or failing request, and its logs explain why.
Candidates who describe three separate tools with no links between them are describing three silos.
3. What is cardinality, and why does it cost money?
Cardinality is the number of unique label combinations for a metric. Each combination is a separate time series that the database stores and indexes.
A request counter with labels for method (5 values), route (50) and status (10) can produce 2,500 series. Add a user_id label with 100,000 users and it can reach 250 million.
High-cardinality detail belongs in traces and logs, which store per-event attributes cheaply, not in metric labels.
OpenTelemetry's SDKs protect themselves: the default cardinality limit is 2,000 combinations per metric stream, after which new combinations fold into a single point marked otel.metric.overflow=true.
Totals stay correct, but any query that filters by an attribute undercounts, which can quietly break an SLO dashboard.
4. Compare RED, USE and the four golden signals.
- RED (Rate, Errors, Duration) for request-driven services: how many requests, how many fail, how long they take.
- USE (Utilization, Saturation, Errors) for resources: CPU, disks, connection pools, queues.
- The four golden signals from the Google SRE book: latency, traffic, errors and saturation. RED plus saturation.
They answer different questions. RED tells you users are hurting; USE tells you which resource is the cause.
A service dashboard usually leads with RED and adds USE panels for the resources it depends on, such as its database connection pool.
5. What makes a log line useful?
Structure and context. A useful log is a structured event, in JSON or as an OTLP log record.
It carries a timestamp, severity, a stable message, the trace and span IDs, and attributes such as order_id or http.route as separate fields rather than text inside the message.
It should also be worth its cost. Log at decision points and failures, not every function entry. Never log secrets or full request bodies on auth routes. Sample or drop high-volume debug logs at the Collector.
A candidate who can say what their service logs per request, and how many bytes that is, has run one in production.
6. How do you control observability costs without going blind?
Decide what each signal is for and pay for that:
- Keep metrics low-cardinality and long-retained; they power alerts and SLOs.
- Sample traces, keeping all errors and slow requests and a fraction of the rest.
- Filter and drop noisy logs at the Collector, and keep full logs for short periods only.
- Drop unused metrics: most backends can report which series are never queried.
The trap is cutting by volume alone. The data you drop should be the data nobody queries, which means measuring usage first.
OpenTelemetry
7. What are the parts of OpenTelemetry?
- API: what libraries and application code call to create spans, metrics and logs. With no SDK installed it does nothing, so libraries can depend on it safely.
- SDK: the implementation that samples, batches and exports.
- OTLP: the wire protocol, over gRPC or HTTP.
- Collector: a separate process that receives, processes and exports telemetry.
- Semantic conventions: standard names for attributes such as
http.request.methodordb.system.name. - Instrumentation libraries and zero-code agents for common frameworks.
Since March 2026 the declarative configuration format is stable. An SDK can now read one YAML file named by OTEL_CONFIG_FILE instead of dozens of environment variables.
Implementations existed in C++, Go, Java, JavaScript and PHP at the time of the announcement.
8. What does the Collector do, and when do you run it as an agent or a gateway?
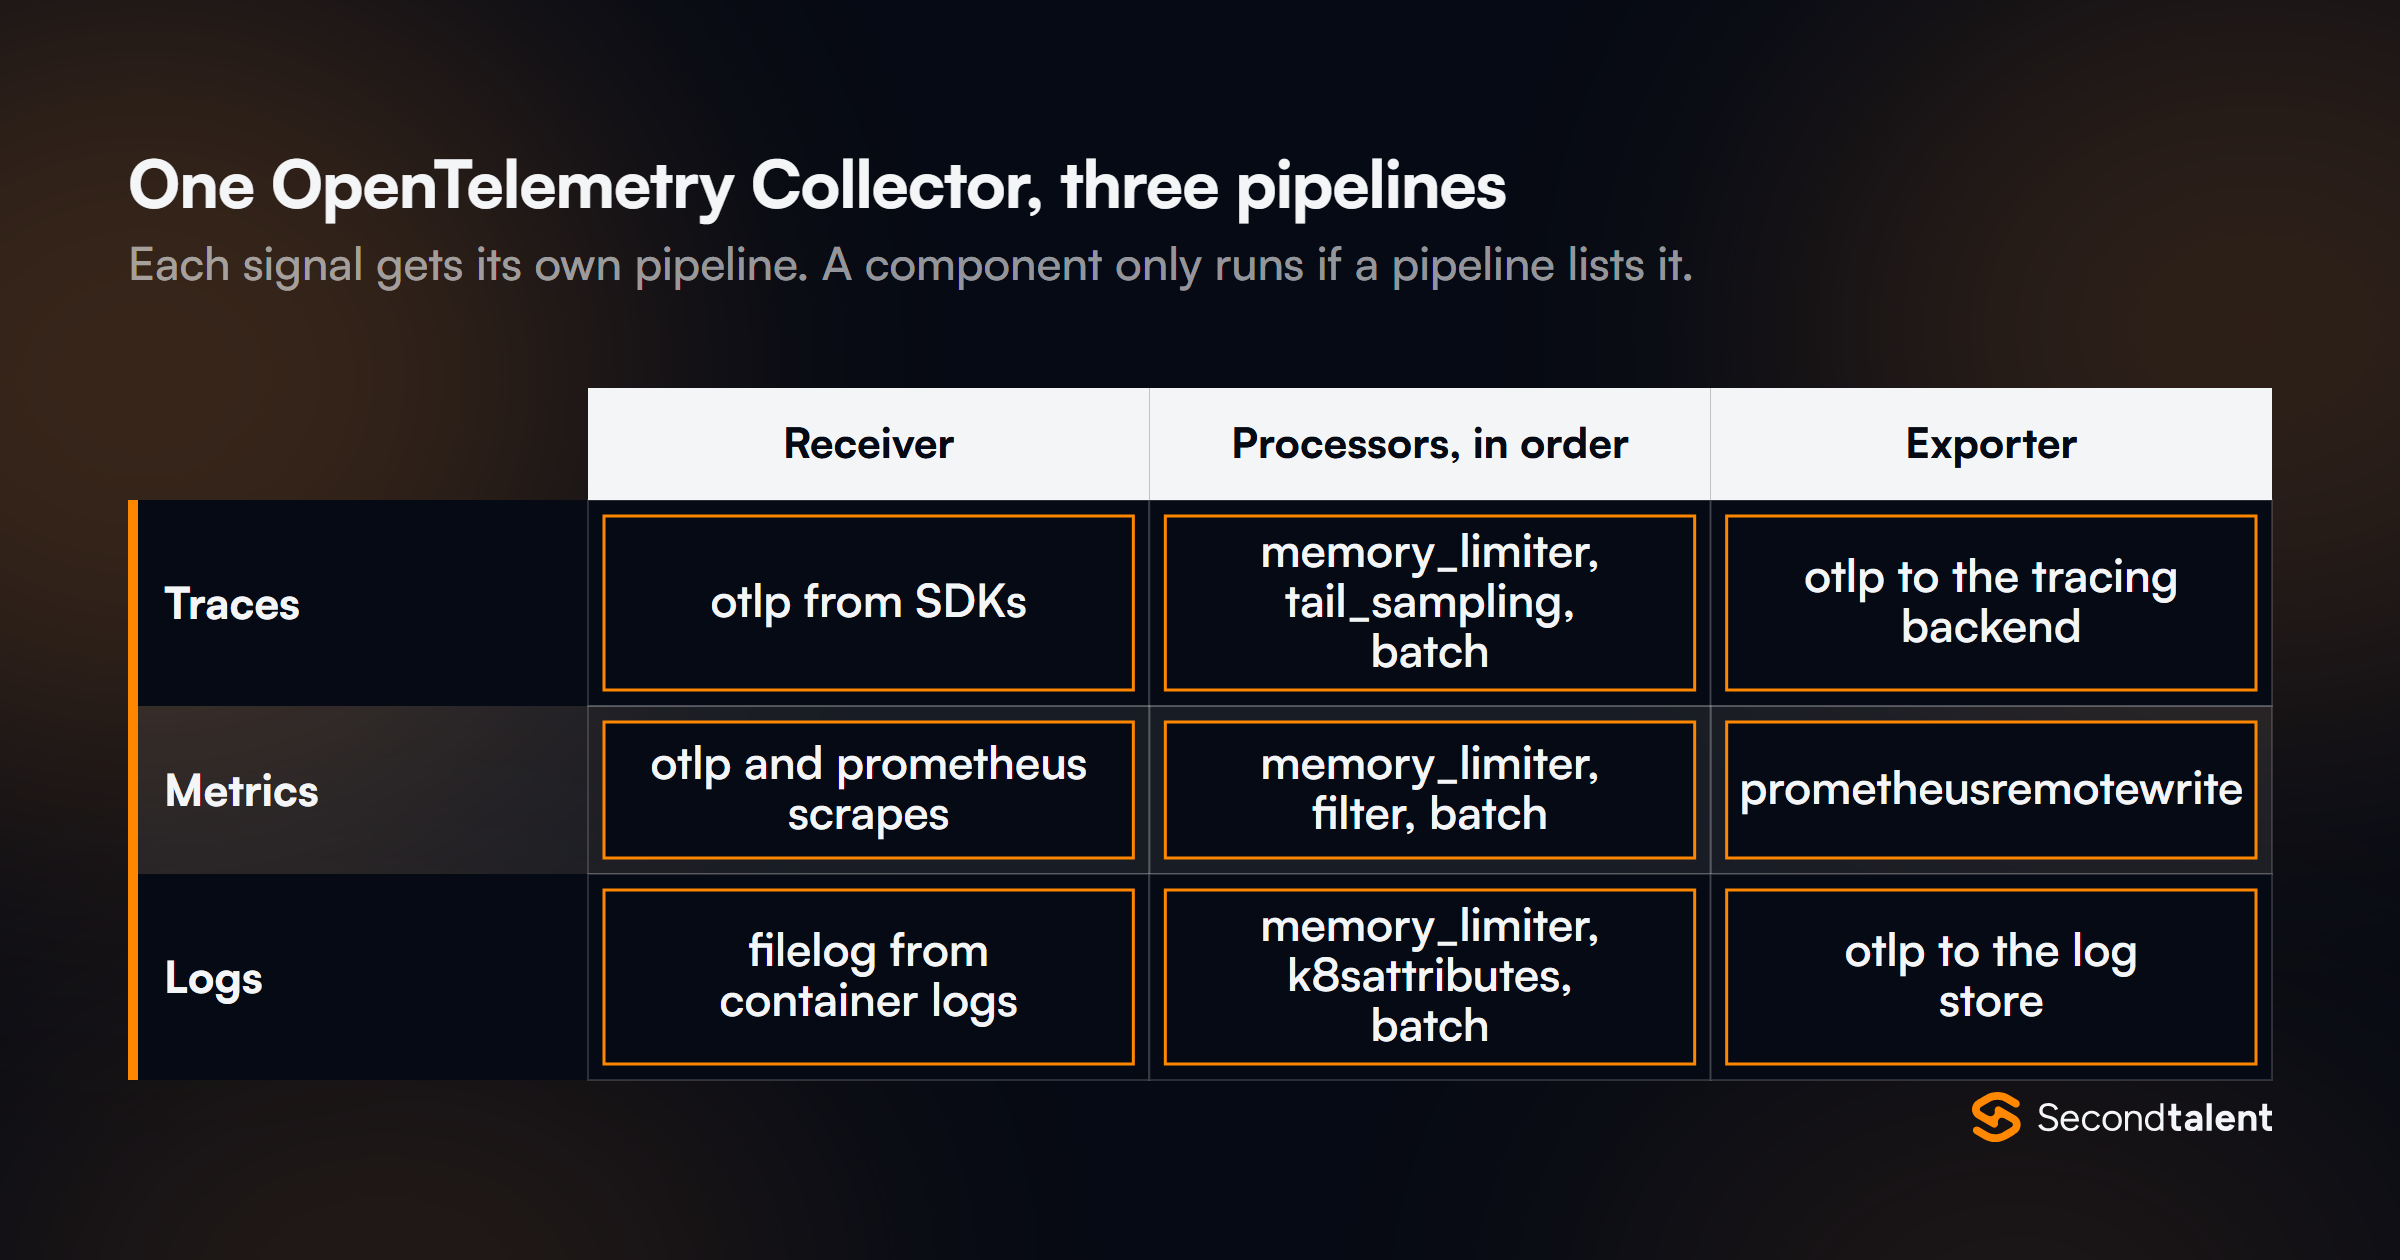
The Collector receives telemetry, processes it and exports it. Each signal runs through a pipeline of receivers, processors and exporters, and a component only runs if a pipeline lists it.
The deployment docs describe two patterns. An agent runs next to the application, often as a Kubernetes DaemonSet, and adds host and Pod metadata.
A gateway is a central pool of Collectors that applications or agents send to; it holds backend credentials and does the heavy processing such as tail sampling. Most production setups use both.
The memory_limiter processor goes first in every pipeline, which its README calls best practice so backpressure reaches the receivers before the process runs out of memory.
service:
  pipelines:
    traces:
      receivers: [otlp]
      processors: [memory_limiter, tail_sampling, batch]
      exporters: [otlp/tracing]
9. Automatic or manual instrumentation?
Both. Automatic instrumentation (Java agent, Python and Node.js auto-instrumentation, .NET profiler-based) covers HTTP servers and clients, database drivers and messaging libraries with no code changes.
It gives the skeleton of every trace on day one.
Manual spans add what only the application knows: the business operation ("apply discount"), attributes such as tenant or plan, and the slow loop inside a handler.
The answer to listen for is "auto-instrument first, then add manual spans where a trace shows a gap", plus awareness that auto-instrumentation adds some startup and runtime overhead worth measuring.
10. What can eBPF-based instrumentation see, and what can it not?
eBPF instrumentation runs outside the application and watches network and system calls in the kernel. OpenTelemetry eBPF Instrumentation (OBI), donated by Grafana Labs from its Beyla project, had its first alpha release on November 3, 2025.
It captures HTTP, gRPC and database calls at the protocol level for any language, with no restarts or code changes.
What it cannot see is inside the process: business context, function-level spans, and in-process queues. Propagating trace context through an application that is not instrumented is also harder from the outside.
It is a strong fit for legacy services and a baseline across a fleet, and a complement to SDK instrumentation rather than a replacement.
11. Why do semantic conventions matter?
They make telemetry from different libraries and languages queryable in the same way.
If every HTTP server records the route as http.route and every database client records db.system.name and db.query.text, a dashboard or alert works across the whole fleet, and backends can build features on those names.
Stability is the part candidates should know. HTTP conventions are stable, and release 1.33.0 (May 2025) marked database conventions stable for PostgreSQL, MySQL, MariaDB and SQL Server.
Instrumentations that migrate between versions can emit old and new names during a transition, which is why queries sometimes need both.
12. What is context propagation, and what does the traceparent header contain?
Context propagation carries the trace ID and the current span ID from one service to the next, so spans from different processes join one trace. Over HTTP, OpenTelemetry uses the W3C Trace Context traceparent header by default.
The OpenTelemetry docs describe its format as version, trace ID, parent span ID and flags:
traceparent: 00-a0892f3577b34da6a3ce929d0e0e4736-f03067aa0ba902b7-01The last byte's lowest bit is the sampled flag. Propagation breaks at boundaries the instrumentation does not know: a custom queue, a thread pool, a batch job.
Finding those gaps, usually as traces that end early, is a routine part of the job.
13. What is baggage, and what are its risks?
Baggage is a set of key-value pairs propagated with the context, in the baggage header, so a value set in one service (a tenant ID, an experiment flag) is readable in every downstream service.
It is not added to spans automatically; a processor or code must copy it.
The risk is that it travels everywhere, including to third-party APIs your services call. The OpenTelemetry baggage docs warn that sensitive items can reach unintended resources because they are sent in plain HTTP headers.
Keep it small, never put personal data or credentials in it, and strip it at the edge of your network.
Distributed Tracing
14. Compare head-based and tail-based sampling.
Head sampling decides when the trace starts, usually by trace ID ratio, and the decision travels with the context.
It is cheap and keeps whole traces, but it cannot know whether a request will fail, so it drops most interesting traces at low rates.
- Decides at the root span
- Runs in the SDK, no extra memory
- Blind to errors and latency
- Decides after the trace completes
- Runs in the Collector, buffers spans
- Keeps every error and slow request
Tail sampling decides after the trace is complete, so it can keep every error and every slow request. The cost is memory and architecture.
The tail sampling processor README says all spans of a trace "MUST be received by the same collector instance". A scaled deployment needs a first tier using the load-balancing exporter to route by trace ID.
Many teams combine a generous head rate with tail rules for errors and latency.
15. How do you find the cause of high latency in a trace?
Find the critical path, then the self time. Start at the root span and follow the child that ends last at each level: that chain is what the user waited for.
Parallel spans off the critical path do not matter for latency, however long they are.
Then look for patterns:
- Gaps between spans: code with no instrumentation, queueing or garbage collection.
- Many short sequential database spans: N+1 queries.
- One long span at the bottom: a slow dependency.
- Repeated identical spans: retries.
Compare the slow trace with a normal trace for the same route to see what differs.
16. How do you trace a request through a message queue?
Inject the trace context into message headers on publish and extract it on consume. The question is how to connect the spans. For one message processed by one consumer, the consumer span can be a child of the producer span.
For batch consumers, which process many messages from different traces at once, span links are the right tool: the processing span links to each message's producer span instead of having one parent.
Candidates should also mention that the time between publish and consume shows queue lag, which is often the real cause of a "slow" async operation.
Metrics and Prometheus
17. Histogram or summary in Prometheus?
Histograms, in almost every case. A summary calculates quantiles inside the application, and the Prometheus docs point out that "you cannot aggregate quantiles": the p99 of ten replicas cannot be computed from their ten p99 values.
A histogram exports bucket counters, which add up across replicas, and the query computes quantiles over any window.
histogram_quantile(0.99,
  sum by (le, route) (rate(http_server_request_duration_seconds_bucket[5m])))
The cost of classic histograms is choosing buckets in advance and paying one series per bucket. Native histograms, covered in question 26, remove both costs.
18. Why is averaging percentiles wrong?
A percentile is not additive. If one instance serves 1,000 requests with a p99 of 100 ms and another serves 10 requests with a p99 of 2 seconds, averaging the two p99s gives about 1.05 seconds, which describes neither instance.
The p99 of the combined 1,010 requests depends on the full shape of both distributions and cannot be derived from those two numbers at all.
The same mistake appears when dashboards average p99 over time with avg_over_time. Compute percentiles from the combined distribution, as histograms allow.
When you need to summarize a period, report the share of requests under a threshold (such as "99.2% under 300 ms"), which does aggregate correctly.
19. What is the difference between rate(), irate() and increase()?
rate() gives the per-second average increase of a counter over the range, handling counter resets. irate() uses only the last two samples in the range, so it reacts faster and is noisier; it suits zoomed-in graphs, not alerts. increase() is rate() multiplied by the range, giving the total increase.
A good follow-up: use a range that spans several scrape intervals so each window holds enough samples, and never apply rate() to a gauge.
Prometheus 3.14 added an experimental option, behind the use-start-timestamps flag, for rate() and increase() to use a counter's start timestamp as an alternative to extrapolation.
20. How do you get metrics from short-lived jobs and serverless functions into a pull-based system?
Pull fails when the process is gone before the next scrape. Options:
- The Pushgateway, but only for what the Prometheus docs call service-level batch jobs. It never forgets pushed series and becomes a single point of failure if used for everything.
- Push over OTLP to a Collector, which aggregates and forwards, or directly to Prometheus through its OTLP receiver.
- Derive metrics from logs or traces that the platform already collects.
The subtle problem with pushing per-invocation counters is aggregation: thousands of function instances each reporting their own counter need a stable identity or a delta-to-cumulative step, or the series explode.
SLOs and Alerting
21. How do you choose good SLIs?
Measure what users experience, as a ratio of good events to total events. Examples: the share of checkout requests that succeed in under 500 ms, the share of messages processed within 5 minutes of publication.
Measure as close to the user as possible, at the load balancer or client, rather than from CPU or memory.
Keep the list short, a few per user journey, and write each one down precisely: which requests count, what "good" means, where it is measured. A vague SLI such as "the API is up" produces arguments during incidents instead of decisions.
22. What is an error budget, and how does it drive decisions?
The error budget is the unreliability the SLO allows: 100% minus the target. It turns reliability into a quantity the team can spend.
When budget remains, the team ships faster and takes risks. When it is spent, the agreed policy applies: freeze risky releases, put engineers on reliability work, or both.
The policy has to be agreed before the budget runs out, or it becomes a negotiation every time.
23. Why alert on burn rate instead of the error rate?
Burn rate measures how fast the budget is being spent relative to plan: a burn rate of 1 uses exactly the whole budget over the SLO window.
Alerting on it ties pages to user impact and to time left, instead of to an arbitrary error-rate threshold.
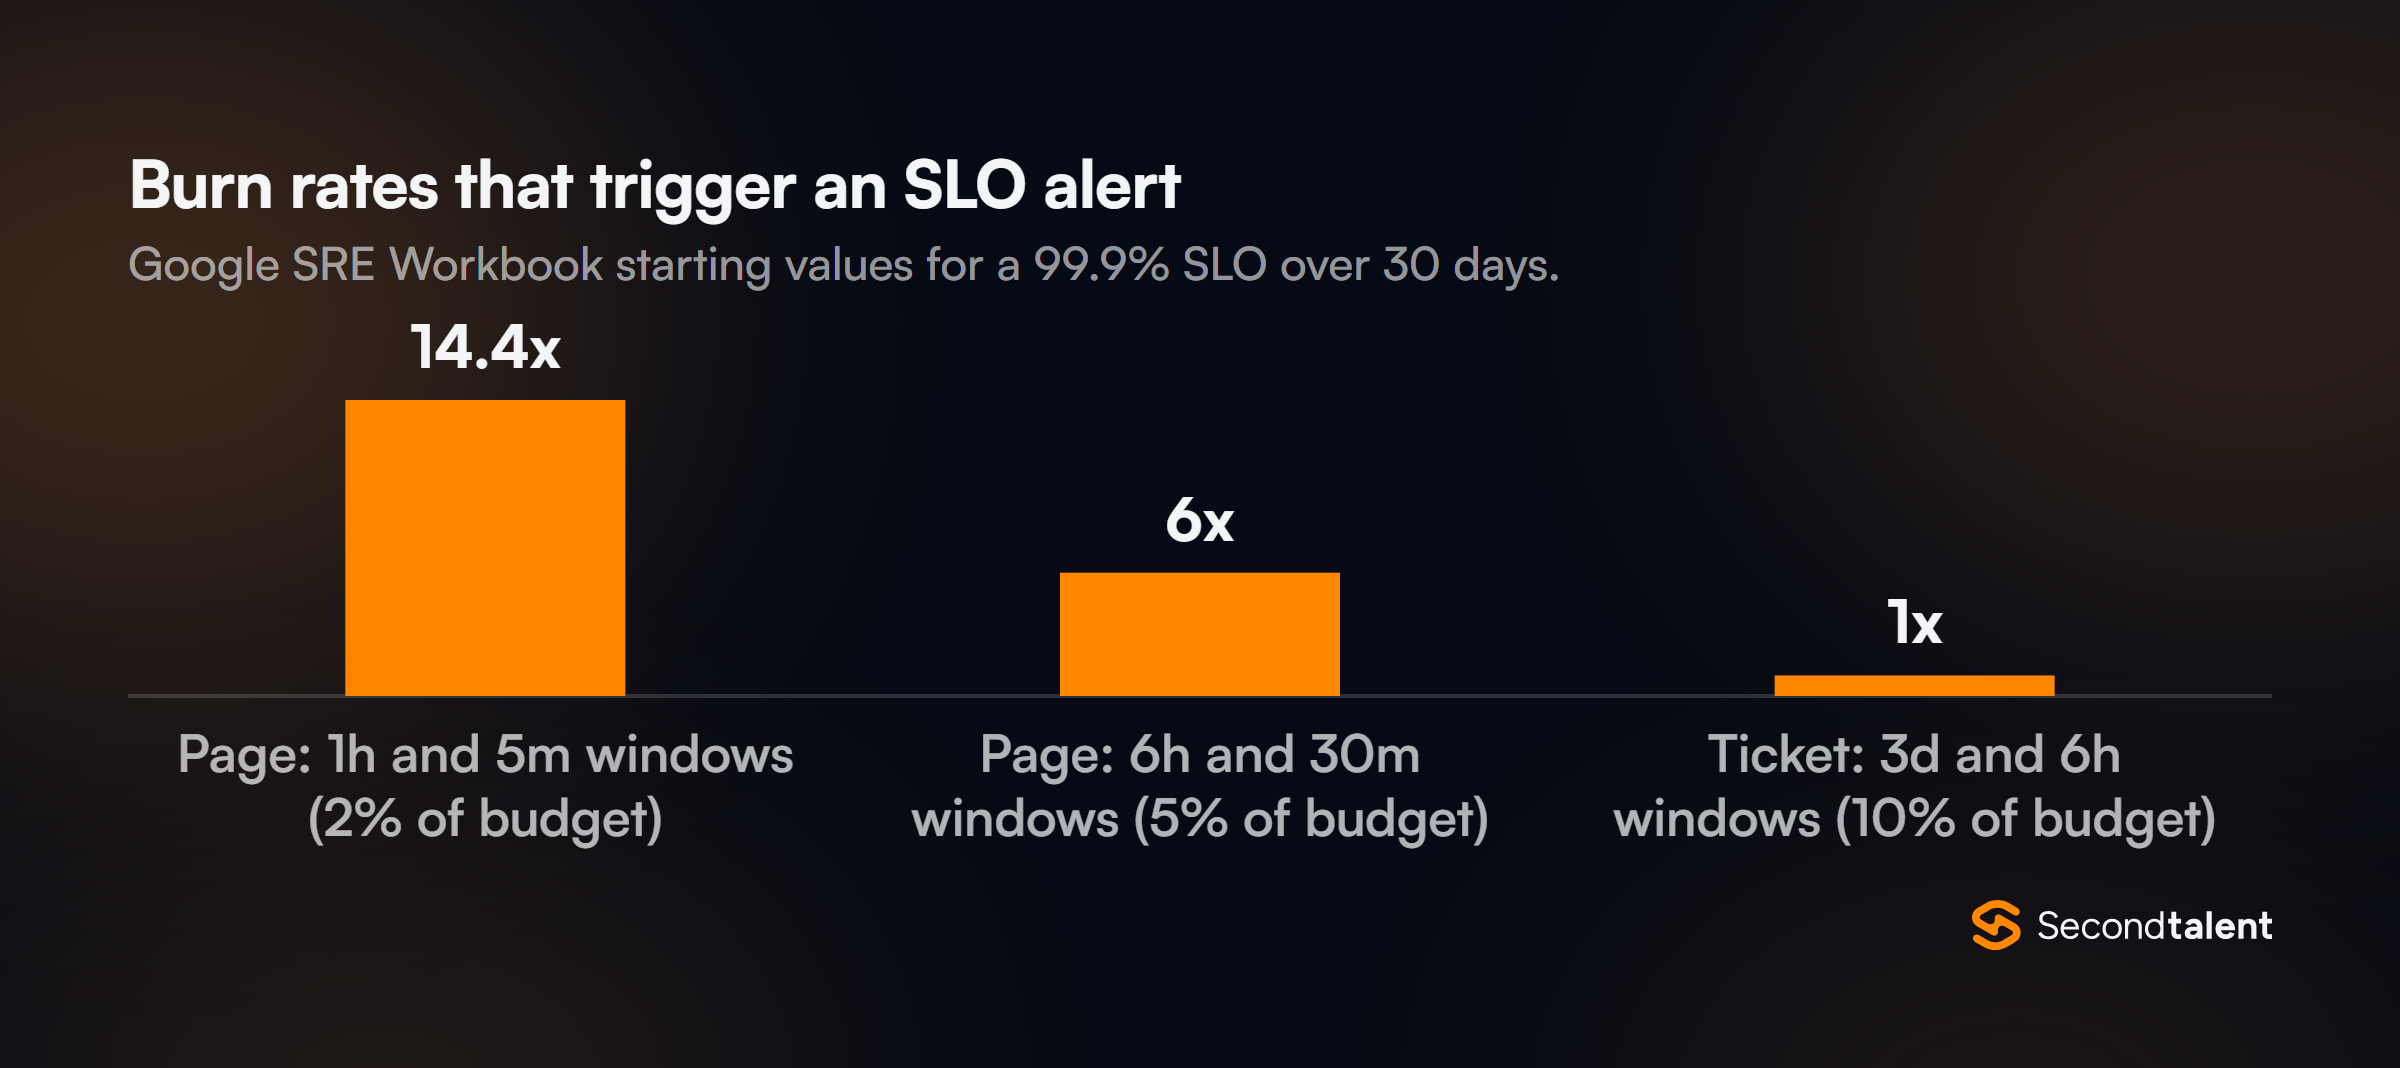
The Google SRE Workbook recommends multiwindow, multi-burn-rate alerts. For a 99.9% SLO it suggests: page at 14.4x over 1 hour (2% of the budget), page at 6x over 6 hours (5%), and open a ticket at 1x over 3 days (10%).
Each alert also checks a short window, one twelfth of the long one, so it stops firing soon after the problem ends.
(
  job:slo_errors_per_request:ratio_rate1h{job="checkout"} > (14.4 * 0.001)
and
  job:slo_errors_per_request:ratio_rate5m{job="checkout"} > (14.4 * 0.001)
)
24. How do you reduce alert fatigue?
Page only on symptoms users feel and that need a human now; everything else becomes a ticket or a dashboard. Every page should be actionable and link to a runbook.
Practical steps:
- Delete alerts nobody acted on in the last quarter.
- Replace cause-based pages, such as high CPU or one pod restarting, with SLO burn-rate pages.
- Group related alerts so one incident produces one page.
- Review the pager load in a regular meeting.
Tracking pages per on-call shift gives the team a number to push down.
What Changed Recently
25. What changed in Prometheus 3?
Prometheus 3.0, released on November 14, 2024, was the first major version in seven years. The changes that matter in interviews:
- UTF-8 metric and label names by default, so OpenTelemetry names with dots no longer need rewriting.
- An OTLP receiver, enabled with
--web.enable-otlp-receiver, so SDKs and Collectors can push straight into Prometheus. - A new web UI with a PromLens-style tree view and an "Explain" tab.
- Left-open range selectors: a sample exactly at the start of the range is now excluded, which can shift results slightly after an upgrade.
- Agent mode became stable, run with
--agent.
Prometheus also now designates long-term support releases: 3.5 in July 2025 and 3.13 in July 2026. The current release as of this writing is 3.15.0, from September 25, 2026.
26. What are native histograms, and are they production-ready?
Yes. Prometheus 3.8.0 (December 2, 2025) is "the first release with Native Histograms as a stable feature".
A native histogram stores the whole distribution as one series with exponential buckets chosen automatically, instead of one series per predefined bucket.
The payoff is higher resolution at lower cost and no bucket guessing. The catch candidates should know: scraping them is off by default. You enable it per job with the scrape_native_histograms setting.
Since 3.9 the old feature flag does nothing, so an upgrade that relied on the flag silently stops collecting native histograms.
27. What is the OpenTelemetry Profiles signal?
A fourth signal for continuous profiling: stack samples of where CPU time and memory go, collected in production at low overhead.
The Profiling SIG announced on March 26, 2026 that Profiles entered public alpha, with a data model compatible with formats such as pprof, a reference eBPF-based profiler and Collector support.
The value for an engineer is correlation. A trace shows that a span took 800 ms; a profile linked to that span shows which functions burned the CPU.
Because it is alpha, the protocol can still change, so it belongs in evaluations, not in contracts.
28. Why did OpenTelemetry deprecate span events?
Because there were two ways to record the same thing. On March 17, 2026 the project deprecated the Span Event API (Span.AddEvent and Span.RecordException).
Events should now be emitted as logs through the Logs API, correlated with the current span.
New instrumentation should write events, including exceptions, as log records. Existing data and backend views that show events on spans keep working.
The practical interview point is a migration plan: new code uses the Logs API, and dashboards that search span events must also search logs during the transition.
29. What changed in Jaeger v2?
Jaeger v2, released on November 10, 2024, is built on the OpenTelemetry Collector framework and extends it with Jaeger's storage and query features. The separate jaeger-agent was removed, and applications send OTLP directly.
For a team running Jaeger, v2 means one binary configured like a Collector, with the same receivers and processors. The last v1 release on Jaeger's GitHub releases page is 1.76.0, from December 2025, so v1 deployments should plan the move.
A candidate who knows Jaeger v2 is "a Collector with a trace store" understands the direction the whole ecosystem took.
30. How is OpenTelemetry making sampling consistent across services?
By agreeing which bits of the trace ID are random. The original TraceIdRatioBased sampler was only safe at the root span, because services could not rely on the same randomness to make matching decisions.
The OpenTelemetry sampling update (October 2025) builds on W3C Trace Context Level 2, which adds a random trace flag.
SDKs record the sampling threshold in the tracestate header under the ot key, for example ot=th:0 for 100% sampling.
With that information, services can apply different sampling rates and still produce complete traces, and backends can estimate true request counts from sampled data.
Ask a senior candidate how their current sampling affects the accuracy of span-derived metrics.
Signs of a Strong Answer
- They keep high-cardinality detail in traces and logs, and can estimate a metric's series count before adding a label.
- They know tail sampling needs trace-aware routing and can describe the two-tier Collector setup.
- They compute percentiles from histograms and never average them.
- They can derive 14.4 from "2% of a 30-day budget in one hour" and explain the short window.
- They name the OpenTelemetry signals and their stability, including that Profiles is alpha.
- They talk about telemetry cost and pager load as numbers they have measured.
Hiring Observability Engineers
Observability engineers sit between development and operations, and the good ones have run on-call with their own dashboards.
Second Talent matches companies with pre-vetted DevOps and SRE engineers and back-end developers from Asia, screened with questions like these.
Tell us the stack and we send a shortlist within 24 hours. Start hiring, or see our logging and monitoring and Kubernetes interview guides.