
Demand for AI engineering talent continues to accelerate into 2026, driven by enterprise adoption of generative AI, automation initiatives, and data infrastructure modernization.
At the same time, engineering teams have become increasingly distributed. As hiring models globalize, compensation disparities across regions have become more consequential for founders and technical leaders managing budgets.
The 2026 Global AI Developer Rate Report was created to provide a structured comparative analysis of engineering costs across more than 15 countries spanning Southeast Asia, India, Eastern Europe, and Latin America.
In addition to salary benchmarking, the report introduces an Engineering ROI Score that synthesizes cost, talent supply, and operational variables into a comparative framework designed to support data-informed hiring decisions.
Across the 18 markets analyzed, the variance between the highest and lowest median senior-level AI engineer salary exceeded 3x.
Job postings for positions involving artificial intelligence surged to record levels in late 2025, with more than one in 25 job ads mentioning AI — a more than 130% increase since early 2020.
Within Southeast Asia, markets such as the Philippines and Vietnam are beginning to appear more frequently in distributed hiring strategies due to their combination of cost efficiency, growing developer communities, and increasing participation in global engineering ecosystems.
Market Context: Hiring AI Engineers in 2026
Demand for AI-related roles remains a defining feature of the 2026 labor market.
- Job postings for positions involving artificial intelligence surged to record levels in late 2025, with more than one in 25 job ads mentioning AI — a more than 130% increase since early 2020 — even as broader hiring slowed in many tech sectors.
- The role of AI engineer has been identified as one of the fastest-growing job titles in the U.S., with postings rising sharply year over year and projected to remain at the forefront of technical hiring demand.
- Per Gartner’s research, broader workforce research shows that a substantial majority of organizations are planning to make remote and distributed work permanent for a growing share of roles by 2026, underscoring the ongoing normalization of geographically dispersed teams and the need for structured cost and talent comparisons across regions.
Methodology and Scope
This report analyzes AI and software engineering compensation data across 18 countries spanning Southeast Asia (including Singapore, Vietnam, Indonesia, Philippines, Malaysia, and Thailand), India, Eastern Europe (including Poland, Romania, and Ukraine), and Latin America (including Brazil, Mexico, Argentina, and Colombia).
Markets were selected based on established engineering export ecosystems, population-scale developer communities, and relevance to U.S.-based hiring managers building distributed teams.
Roles analyzed include AI/ML Engineers, Back-end Engineers, Front-end Engineers, DevOps Engineers, and QA Engineers.
For each role, compensation was segmented by seniority (mid-level and senior-level) to reflect realistic hiring patterns for AI-enabled product teams.
Salary benchmarks were aggregated from publicly available compensation datasets, national labor statistics where available, and international salary reporting platforms.
All figures were standardized to estimated annual employer cost in USD to allow cross-market comparison. Currency conversions were applied using average 2025 exchange rates.
Compensation figures reflect direct salary cost and do not include benefits, equity, or overhead, which may vary significantly by jurisdiction. As with all cross-border salary analyses, local market volatility and reporting variance should be considered when interpreting ranges.
Key Findings
Several measurable patterns emerged across the 18 markets analyzed.
- Southeast Asian and certain Latin American markets ranked lowest in median AI/ML engineer salary when measured in annual USD employer cost. India also demonstrated lower median compensation relative to Eastern Europe and mature Asian hubs.
- Eastern European markets showed narrower variance between mid-level and senior-level compensation bands, suggesting tighter clustering of senior pay relative to emerging markets.
- Markets with higher median AI engineer salaries also showed proportionally higher backend and DevOps compensation, reinforcing regional clustering across full engineering stacks.
- Latin American countries demonstrated stronger average U.S. time-zone alignment compared to Southeast Asia, offering greater same-day collaboration windows.
Finally, markets with larger reported developer populations, including India and Brazil, showed stronger indicators of hiring depth relative to smaller talent ecosystems, according to global developer participation data reported by Stack Overflow.
AI/ML Engineer Rate Comparison
AI/ML engineer compensation continues to show substantial regional variance in 2026.
- In the United States, median annual pay for AI engineers remains among the highest globally.
- According to the U.S. Bureau of Labor Statistics, the median annual wage for computer and information research scientists — a category that includes AI-related roles — was $140,910 as of May 2024.
- In contrast, salary reporting platforms and regional labor data indicate materially lower median annual costs across Southeast Asia, India, Eastern Europe, and Latin America, often ranging between approximately $35,000 and $75,000 depending on seniority and market maturity.
- Senior-level AI/ML engineers demonstrate even wider variance. In more mature technical hubs such as Poland and Singapore, senior compensation trends closer to developed-market levels, while emerging Southeast Asian and Latin American markets typically reflect lower median employer costs.
- Across the 18 markets analyzed, the variance between the highest and lowest median senior-level AI engineer salary exceeded 3x.
The data shows clustering by region rather than uniform global convergence, reinforcing the importance of market-specific benchmarking when planning distributed AI hiring strategies.
Median / Average AI Engineer Salaries by Market (USD)
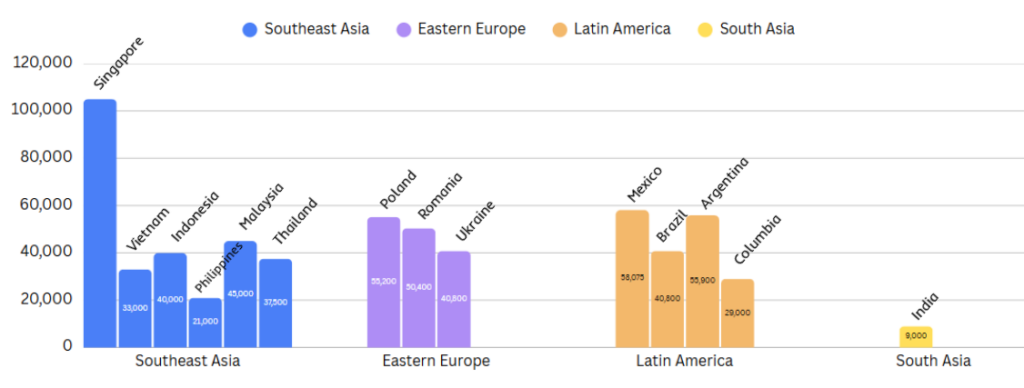
| Region | Market | Median / Average AI Engineer Salary (USD) |
| Southeast Asia | Singapore | $80,000-$150,000 |
| Southeast Asia | Vietnam | $30,000-$35,000 |
| Southeast Asia | Indonesia | $35,000–$45,000 |
| Southeast Asia | Philippines | $12,000-$30,000 |
| Southeast Asia | Malaysia | $40,000–$50,000 |
| Southeast Asia | Thailand | $35,000-$40,000 |
| Eastern Europe | Poland | $55,200 |
| Eastern Europe | Romania | $50,400 |
| Eastern Europe | Ukraine | $40,800 |
| Latin America | Mexico | $58,075 |
| Latin America | Brazil | $40,800 |
| Latin America | Argentina | $55,900 |
| Latin America | Colombia | $19,700–$38,200 |
| South Asia | India | $17,323 |
Supporting Engineering Roles Cost Breakdown
AI product development rarely relies on AI/ML engineers alone.
- Production-ready systems typically require backend infrastructure, DevOps support, frontend implementation, and quality assurance capacity.
- According to McKinsey, scaling AI successfully requires “cross-functional teams that include data engineers, machine learning engineers, and DevOps specialists,” highlighting the multidisciplinary nature of deployment.
- Compensation data across the 18 markets analyzed shows predictable tiering across roles. Back-end and DevOps engineers generally command salaries comparable to or slightly below AI/ML engineers in most regions.
- Front-end roles show moderate variance depending on specialization, while QA positions consistently reflect the lowest median compensation within the engineering stack.
However, relative differences between regions persist across all roles.
Markets with higher AI engineer medians also tend to show proportionally higher backend and DevOps costs, suggesting regional salary clustering affects entire engineering teams rather than isolated roles.
Blended Team Cost Scenarios
To contextualize role-based salary differences, this report modeled two representative hiring scenarios using median annual employer cost data across the 18 analyzed markets.
Scenario A
This scenario models a five-person AI team composed of one senior AI/ML engineer, two mid-level back-end engineers, one DevOps engineer, and one QA engineer.
In higher-cost markets such as the United States or Singapore, the estimated annual salary outlay for this configuration exceeds $600,000.
In Eastern European markets, modeled annual cost ranges approximately between $250,000 and $350,000.
In several Southeast Asian and Latin American markets, the same team configuration falls closer to $180,000–$280,000 annually.
Scenario B
This scenario expands to a ten-person team, adding front-end capacity and additional AI/ML and back-end support.
In this scenario, annual cost differences between regions widen proportionally, with mature markets clustering above $1.1 million annually while lower-cost regions remain below $500,000 in modeled salary expenditure.
The distribution of costs forms regional bands rather than isolated outliers, reinforcing the structural impact geography has on overall engineering budget planning.
Cost Per Sprint Analysis
To translate annual compensation into delivery economics, modeled team salaries were converted into estimated cost per two-week sprint.
Assuming 26 two-week sprints per year and a stable productivity baseline across regions, a five-person AI team in a higher-cost market exceeding $600,000 annually equates to approximately $23,000 per sprint in salary cost alone.
In contrast, a similarly structured team modeled at $220,000 annually reflects an estimated sprint cost closer to $8,500.
For ten-person teams, the variance scales proportionally.
A $1.1 million annual salary structure translates to roughly $42,000 per sprint, compared with approximately $19,000 per sprint in lower-cost regions.
These figures reflect compensation only and do not incorporate tooling, infrastructure, or management overhead.
Engineering ROI Score Framework
Salary differentials alone do not fully capture the operational implications of distributed AI hiring.
- To provide a structured comparison across markets, this report introduces an Engineering ROI Score designed to synthesize multiple variables into a comparative framework.
- The score incorporates five weighted inputs: median salary cost, relative talent supply, English proficiency indicators, time zone overlap with U.S. business hours, and hiring speed proxies derived from reported talent pool depth.
- Talent supply context draws on global developer population data, including findings from the Stack Overflow Developer Survey, which continues to show strong developer participation across India, Eastern Europe, and Southeast Asia.

The Engineering ROI Score is not intended as an absolute measure of quality or productivity. Rather, it provides a standardized way to compare cost structure alongside coordination and hiring variables that materially influence distributed team performance.
The model combines five indicators that commonly influence distributed engineering outcomes: salary cost efficiency, local talent supply, English proficiency, time-zone overlap with U.S. business hours, and hiring depth indicators derived from developer population estimates.
Each factor is scored on a 0–10 scale to allow relative comparison between markets. The five inputs are then combined into a single index score using the following formula:
Engineering ROI Score = (Cost Efficiency + Talent Supply + English Proficiency + Time Zone Alignment + Hiring Depth) ÷ 50 × 100
The resulting score ranges from 0 to 100 and is intended for comparative benchmarking rather than absolute ranking. The model does not measure productivity or engineer quality; instead, it provides a structured way to synthesize cost structure with operational coordination variables that often influence distributed hiring decisions.
| Region | Market | Cost Efficiency | Talent Supply | English Proficiency | Time Zone Alignment (US) | Hiring Depth | Engineering ROI Score |
| *Each factor is scored between 0-10, and carries a different multiplier weight based on importance in the hiring decision considerations. | |||||||
| Southeast Asia | Singapore | 4 | 7 | 10 | 4 | 7 | 51 |
| Southeast Asia | Vietnam | 9 | 7 | 6 | 4 | 7 | 67 |
| Southeast Asia | Indonesia | 8 | 7 | 6 | 4 | 6 | 62 |
| Southeast Asia | Philippines | 10 | 6 | 9 | 5 | 6 | 72 |
| Southeast Asia | Malaysia | 7 | 6 | 8 | 4 | 6 | 58 |
| Southeast Asia | Thailand | 8 | 6 | 5 | 4 | 5 | 58 |
| Eastern Europe | Poland | 6 | 8 | 8 | 6 | 8 | 62 |
| Eastern Europe | Romania | 7 | 7 | 8 | 6 | 7 | 63 |
| Eastern Europe | Ukraine | 7 | 8 | 7 | 6 | 7 | 64 |
| Latin America | Mexico | 6 | 8 | 6 | 10 | 8 | 64 |
| Latin America | Brazil | 7 | 9 | 6 | 9 | 9 | 70 |
| Latin America | Argentina | 7 | 7 | 7 | 9 | 7 | 65 |
| Latin America | Colombia | 8 | 7 | 7 | 10 | 7 | 70 |
| South Asia | India | 10 | 10 | 8 | 5 | 10 | 83 |
Key Observations from the Engineering ROI Score
•Southeast Asian and certain Latin American markets ranked lowest in median AI/ML engineer salary when measured in annual USD employer cost. India also demonstrated lower median compensation relative to Eastern Europe and mature Asian hubs.
• Latin American countries demonstrated stronger average U.S. time-zone alignment compared to Southeast Asia, offering greater same-day collaboration windows.
• Eastern European markets showed narrower variance between mid-level and senior-level compensation bands, suggesting tighter clustering of senior pay relative to emerging markets.
• Southeast Asian markets tended to rank highest on salary cost efficiency, with countries such as the Philippines and Vietnam showing some of the lowest median AI engineer compensation levels in the dataset.
• Higher-salary markets such as Singapore scored strongly on English proficiency and broader ecosystem indicators such as talent supply and hiring depth, but showed lower cost-efficiency scores relative to emerging markets.
• Within Southeast Asia, the Philippines and Vietnam showed relatively strong Engineering ROI scores driven primarily by cost efficiency and growing engineering talent pools. Both markets have seen increasing participation in global developer communities in recent years, indicating expanding technical ecosystems.
• Across regions, the results suggest that engineering ROI is shaped by a combination of economic factors, workforce depth, and operational alignment variables rather than compensation levels alone.
Implications for Distributed AI Teams
The 2026 data reinforces that geography meaningfully shapes the cost structure of AI product development.
Median salary differences alone can shift total team expenditure by several hundred thousand dollars annually, particularly as teams scale beyond a single AI/ML hire. A
At the same time, collaboration overlap, hiring depth, and English proficiency vary by region in ways that influence operational cadence.
Research from Deloitte notes that organizations increasingly view distributed talent models as a structural workforce strategy rather than a temporary adjustment.
In that context, comparative cost data becomes less about opportunistic arbitrage and more about deliberate design of globally distributed engineering systems. Regional differences extend beyond compensation and require balanced evaluation across financial and coordination variables.

Hire at these rates, right from the platform.
Browse pre-vetted senior engineers, see live rates, and hire on Second Talent. Free to start, no upfront fees.
Try for Free